Monitoring System Enterprise Architecture Evolution — First Steps with Prometheus
Prometheus is an open-source monitoring and time series database system that has gained widespread adoption in recent years.
The official architecture diagram is shown below:

This series of articles will gradually understand and deepen various components and concepts through the deployment architecture evolution of Prometheus in an enterprise.
First, let’s get a quick overview of this evolution history through the diagram below:
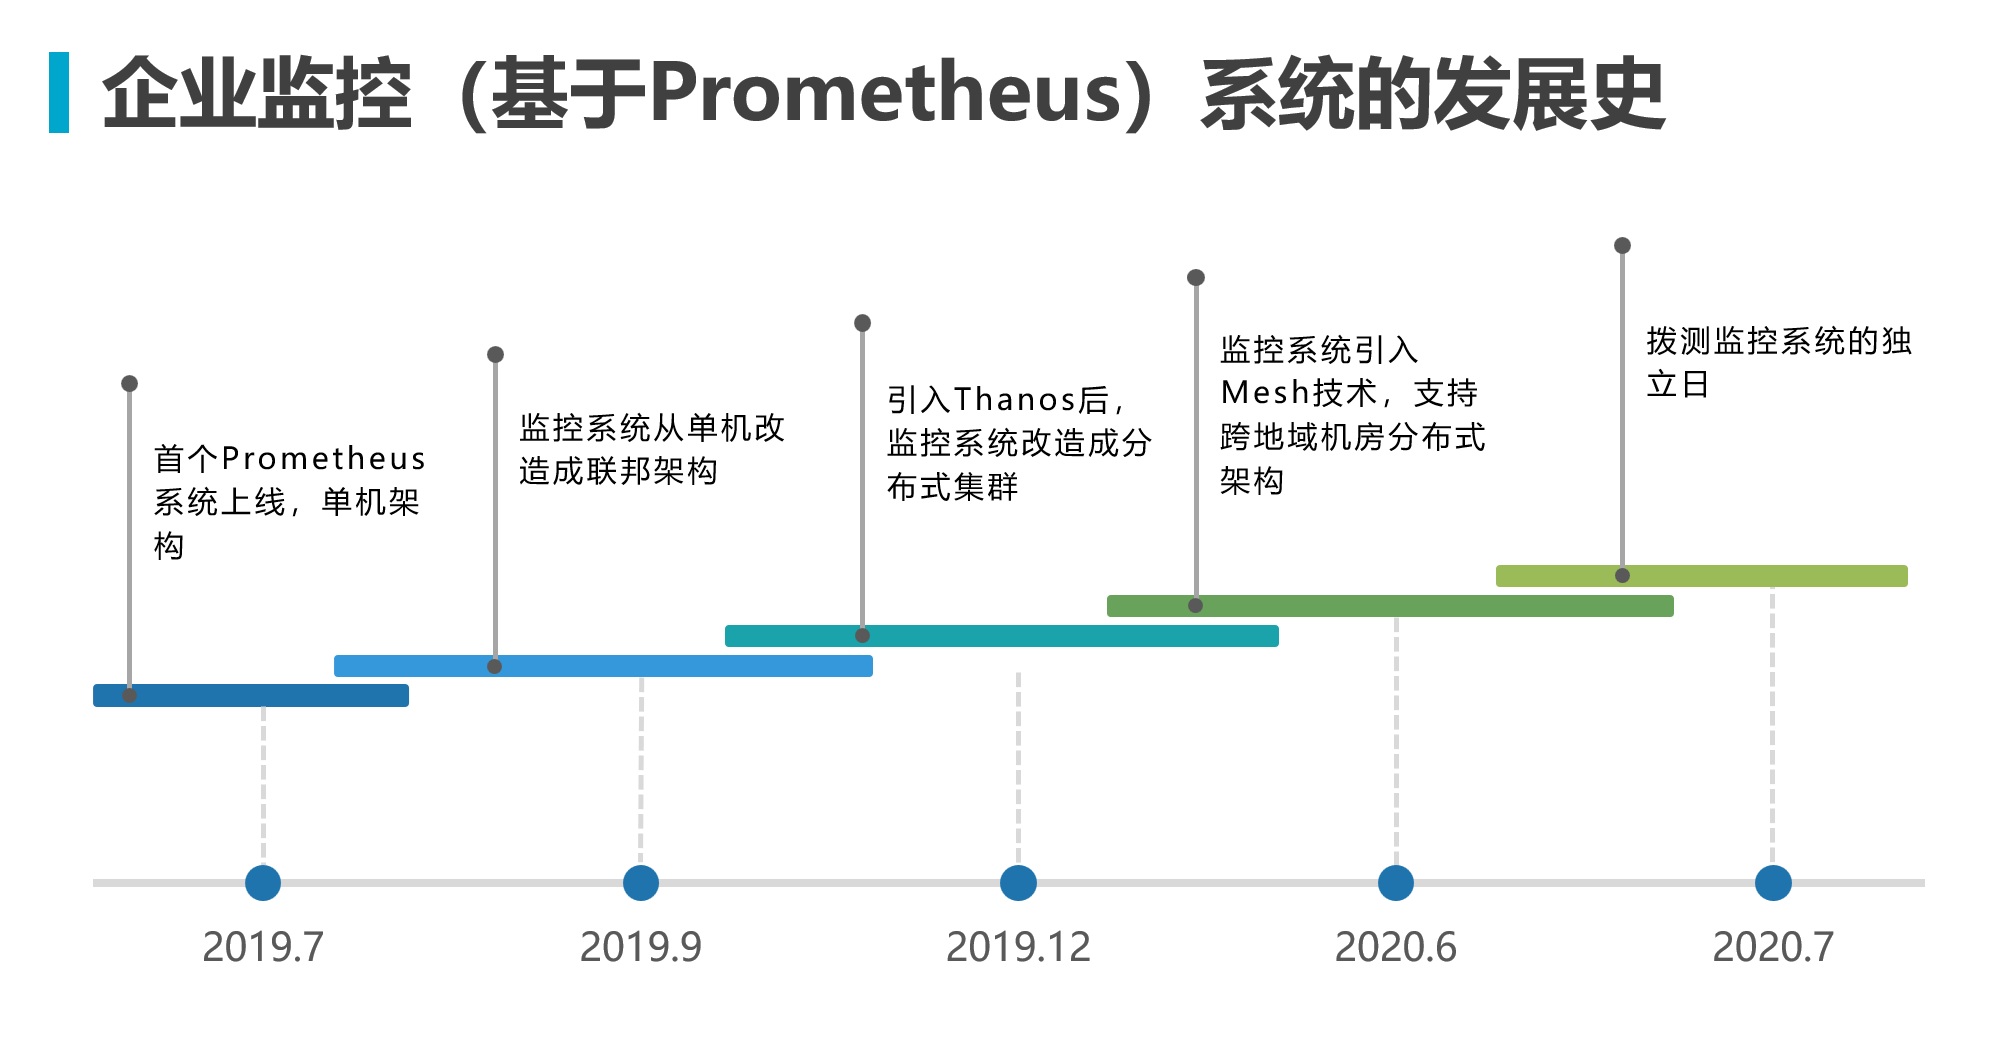
Single Node Architecture
When first getting started with the Prometheus monitoring system, you only need to deploy the Prometheus binary on the server side, using the basic file service discovery configuration file_sd_config to pull metrics from node_exporter for basic host monitoring.
Then configure the Prometheus url address as a datasource in Grafana to start viewing monitoring data.
graph TB
    NE@{ shape: rounded, label: "node_exporter" } -->|metrics| P@{ shape: rounded, label: "Prometheus" }
    P -->|data| G@{ shape: rounded, label: "Grafana" }

    classDef src fill:#bbdefb,stroke:#2196F3,color:#1B5E20
    classDef proc fill:#fff3e0,stroke:#FF9800,color:#BF360C
    classDef out fill:#c8e6c9,stroke:#4CAF50,color:#1B5E20
    class NE src
    class P proc
    class G out
Prometheus’s data model consists mainly of Metric, Label, and Sample.
Metric:
- Represents a time series metric, corresponding to a monitoring metric name. E.g., cpu_usage, free_memory, etc.
- Metric only contains the time series data name, with no predefined structure or type. This gives Prometheus high flexibility.
- A single Prometheus instance can contain any number of Metrics.
Label:
- Used to describe and distinguish data with the same Metric. Similar to Tags in other time series databases.
- Labels typically represent dimensions or attributes of data, such as instance, job, region, etc.
- Each sample must include the same set of Labels. Labels are used for fast querying and aggregation of specific dimensions.
- Label values can be strings, booleans, or integers. Supports filtering and grouping data by Labels.
Sample:
- Represents a single time series data point, containing Timestamp, Value, and Label set.
- Timestamp indicates the time of the sample, with millisecond precision. It is used for sorting and querying data within a given time range.
- Value represents the metric value, which can be a float, integer, or string.
- Label set identifies the attributes and dimensions of the sample data. Samples with the same Labels represent different records of the same metric.
A Prometheus Sample contains:
| |
For example:
| |
Below is a sample of the collected data structure:
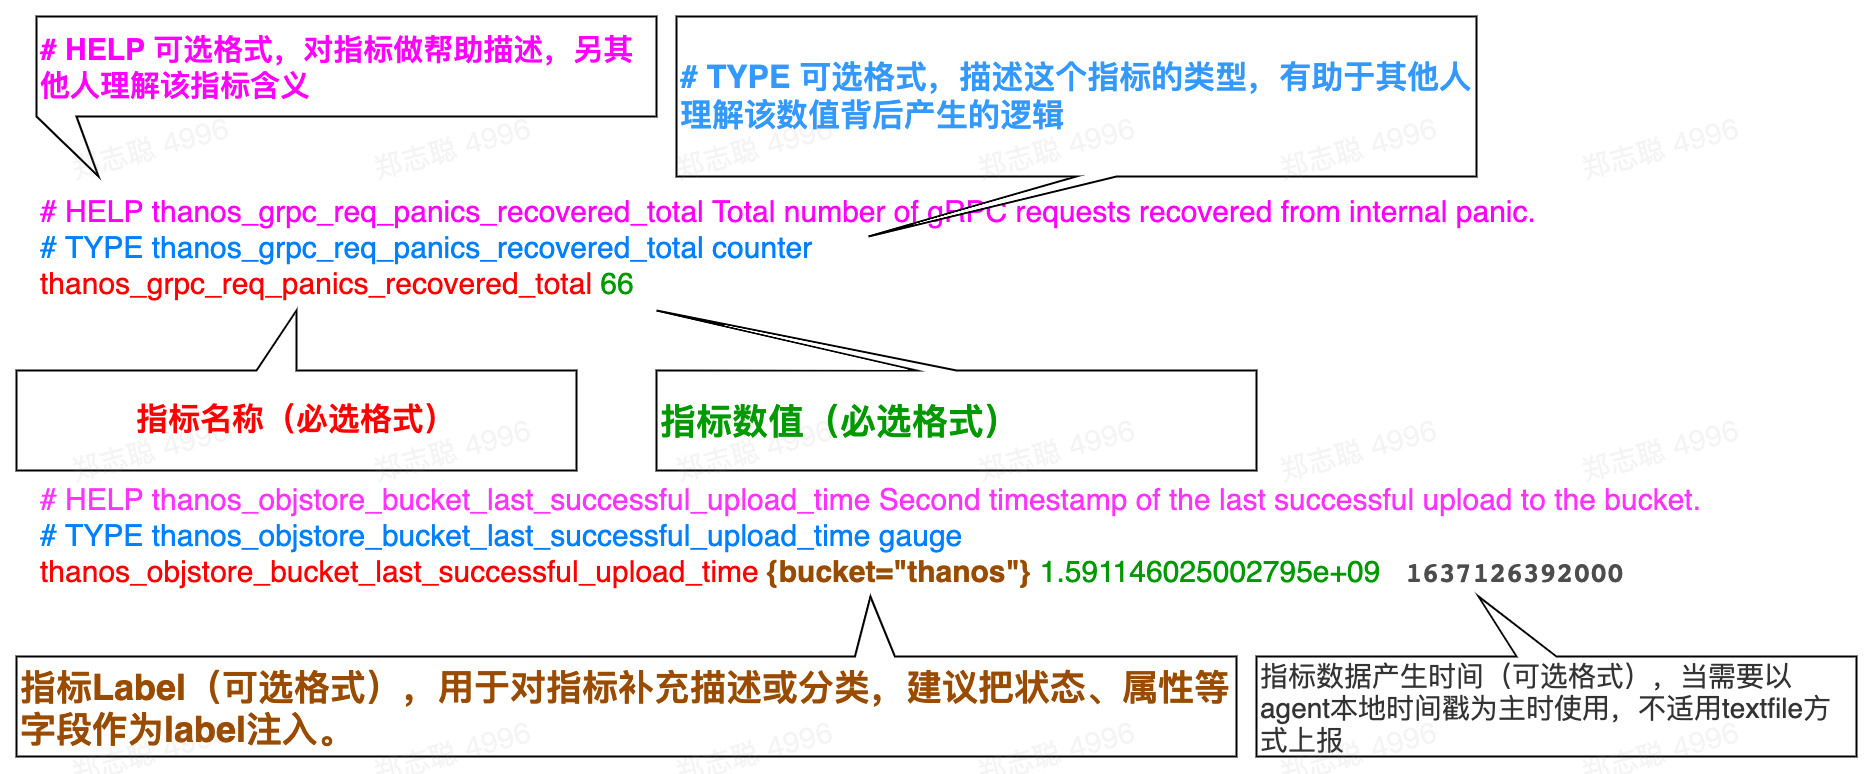
| |
Prometheus defines four main metric types:
- Gauge - Suitable for metrics that can arbitrarily change, such as temperature, pressure.
- Counter - A monotonically increasing metric, suitable for recording request counts, task completions, error counts, etc.
- Histogram - Typically used for recording request duration, response size, etc. It records value distribution by configuring buckets. Can be used to calculate percentiles, averages, etc.
- Summary - Similar to Histogram, directly stores percentile values for more convenient percentile computation.
These four metric types can represent different kinds of metrics:
- Gauge: Instantaneous value
- Counter: Cumulative total
- Histogram/Summary: Statistical distribution
Choose the appropriate type based on the monitoring metric required. Prometheus handles metrics differently depending on their type when scraping and storing samples. Let’s look at the following case.
Alert Configuration
When alerting is needed, you must deploy the Alertmanager component and configure Alertmanager information in Prometheus. Alert rules need to be configured in Prometheus for periodic evaluation, sending alerts that meet thresholds to the Alertmanager component for processing.
Here’s a brief explanation of
Prometheus’s alert mechanism and its relationship withAlertmanager:
Prometheusalert rulesPrometheusserver defines alert rules, which determine whether to generate alerts based onPromQLexpressions. When the expression output istrue, an alert event is created.Prometheusalert processingPrometheusrecords these alert events and displays alert information on its status page.Prometheuscan also send alert information to external systems viaWebhook.AlertmanageroverviewAlertmanageris an independent alert management component. It supports alert deduplication, grouping, routing, and sending. Alerts generated byPrometheusserver are sent toAlertmanager.Alertmanageralert processing After receiving alerts,Alertmanagercan group them according to defined grouping rules, then send them to corresponding receivers (such as email,Slack, etc.) based on routing rules. It also handles alert deduplication.PrometheusandAlertmanagerintegration Configure theAlertmanagerURLaddress inPrometheus, so alerts generated byPrometheusare automatically sent toAlertmanager. Together, they form a dynamic alert management mechanism.In summary,
Prometheusis responsible for alert detection and generation, whileAlertmanagerfocuses on subsequent alert distribution, processing, and notification. Their integration achieves a complete monitoring-to-alerting pipeline.
graph TB
    NE@{ shape: rounded, label: "node_exporter" } -->|metrics| P@{ shape: rounded, label: "Prometheus" }
    P -->|data| G@{ shape: rounded, label: "Grafana" }
    P -->|alerts| AM@{ shape: rounded, label: "Alertmanager" }

    classDef src fill:#bbdefb,stroke:#2196F3,color:#1B5E20
    classDef proc fill:#fff3e0,stroke:#FF9800,color:#BF360C
    classDef out fill:#c8e6c9,stroke:#4CAF50,color:#1B5E20
    classDef spec fill:#f3e5f5,stroke:#9C27B0,color:#4A148C
    class NE src
    class P proc
    class G out
class AM specinactive: Threshold not triggeredpending: Threshold triggered but alert duration not yet metfiring: Threshold triggered and alert duration satisfied
Let’s understand with a simple example. Below is a mysql alert configuration. The metric collection interval is 5s per sample, and the rule evaluates every 10s. When uptime is less than 30s, the alert is triggered.
| |
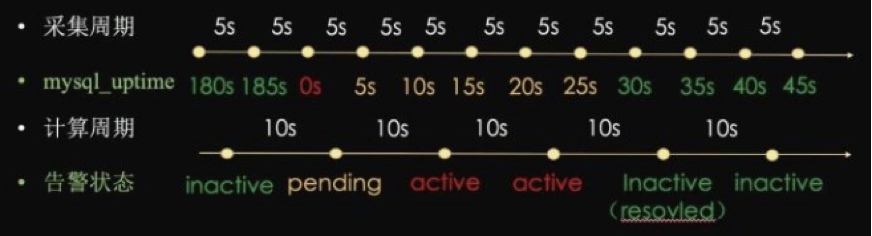 As shown in the diagram:
- When
mysql_uptime >= 30, the alert status isinactive - When
mysql_uptime < 30and duration is less than10s, the alert status ispending - When
mysql_uptime < 30and duration is greater than10s, the alert status isfiring
⚠ Note: The
forkeyword in the configuration is used to set the alert duration; ifforis not set or set to 0, thependingstate will be skipped directly.
Internal Alert Logic
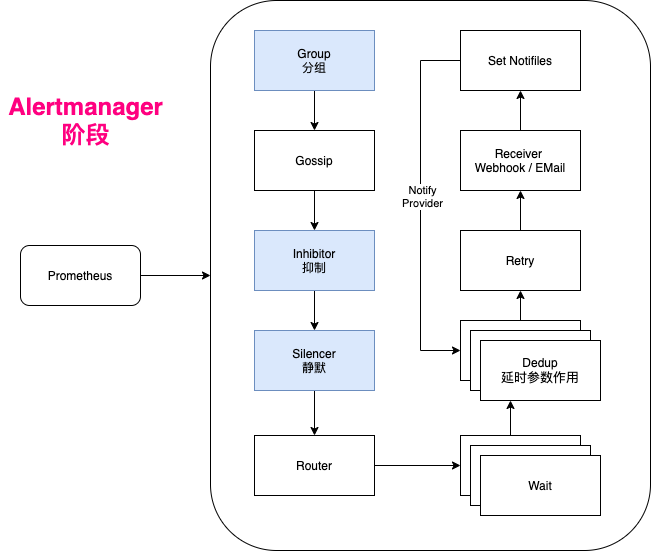
The internal mechanism can be summarized in the following steps:
- Alert reception: After Alertmanager receives alerts from Prometheus and other sources, it groups them according to configuration.
- Alert grouping: Similar or related alerts are aggregated into alert groups, defined by grouping rules in the configuration file.
- Alert deduplication: Duplicate alerts are deduplicated to prevent repeated sending.
- Alert routing: Based on alert matching rules, determines the sending path for the alert group, which may be via email, Slack, or Webhook.
- Silencing and inhibition: Directly silences or inhibits certain alert information during the alert phase based on configuration.
- Alert sending: Finally, Alertmanager sends processed alerts to recipients via email, SMS, phone, etc.
Federation Deployment
When reaching a certain scale, multiple Prometheus instances are needed to share the collection and computation load. A federated deployment approach can be used to extend the architecture.
graph TB
    FP@{ shape: rounded, label: "Prometheus federation node" }
    P1@{ shape: rounded, label: "Region A<br/>Prometheus + node_exporter" }
    P2@{ shape: rounded, label: "Region B<br/>Prometheus + node_exporter" }
    FP -->|federal pull| P1
    FP -->|federal pull| P2

    classDef src fill:#bbdefb,stroke:#2196F3,color:#1B5E20
    classDef proc fill:#fff3e0,stroke:#FF9800,color:#BF360C
    class FP proc
    class P1,P2 src
Distributed Architecture Prototype
As the business expands, the monitoring system also grows. Both from an architecture management and stability perspective, it’s necessary to upgrade from a single-node to a clustered architecture. There are several options in the industry:
Grafanacommunity’sCortexsolutionThanoscommunity solution
Here, the Thanos distributed solution was chosen, while also introducing HashiCorp’s Consul to replace file-based service discovery.
Data Processing Logical Architecture
By introducing Consul to manage the exporter collector information that needs monitoring, operations teams can use scripts to periodically synchronize infrastructure and business component information from CMDB/CICD systems to this architecture, enabling dynamic discovery and collection.
Additionally, the Thanos Sidecar component synchronizes TSDB BLOCK to object storage for backup.

Data Query Logical Architecture
The frontend query uses the Thanos Query component to provide a unified query entry for the entire distributed cluster. Thanos Query has built-in data deduplication and union query capabilities.
Historical data can be aggregated over long periods and downsampled by the Thanos Compact component to optimize underlying TSDB BLOCK.
Data from object storage is exposed via the Thanos Store API to reduce computational pressure on Prometheus.
graph TB
    G@{ shape: rounded, label: "Grafana" } -->|query| TQ@{ shape: rounded, label: "Thanos Query Unified Query Entry" }
    TQ -->|gRPC| PS@{ shape: rounded, label: "Prometheus + Thanos Sidecar" }
    TQ -->|gRPC| TS@{ shape: rounded, label: "Thanos Store" }
    TS -->|read| O@{shape: cyl, label: "S3 Object Storage One set per region" }
    PS -->|sync TSDB BLOCK| O
    TC@{ shape: rounded, label: "Thanos Compact Data Aggregation and Downsampling" } -->|compact| O

    classDef src fill:#bbdefb,stroke:#2196F3,color:#1B5E20
    classDef proc fill:#fff3e0,stroke:#FF9800,color:#BF360C
    classDef store fill:#c8e6c9,stroke:#4CAF50,color:#1B5E20
    class G src
    class TQ,PS,TS,TC proc
    class O store