Monitoring System Enterprise Architecture Evolution — Probing Monitoring
Recap
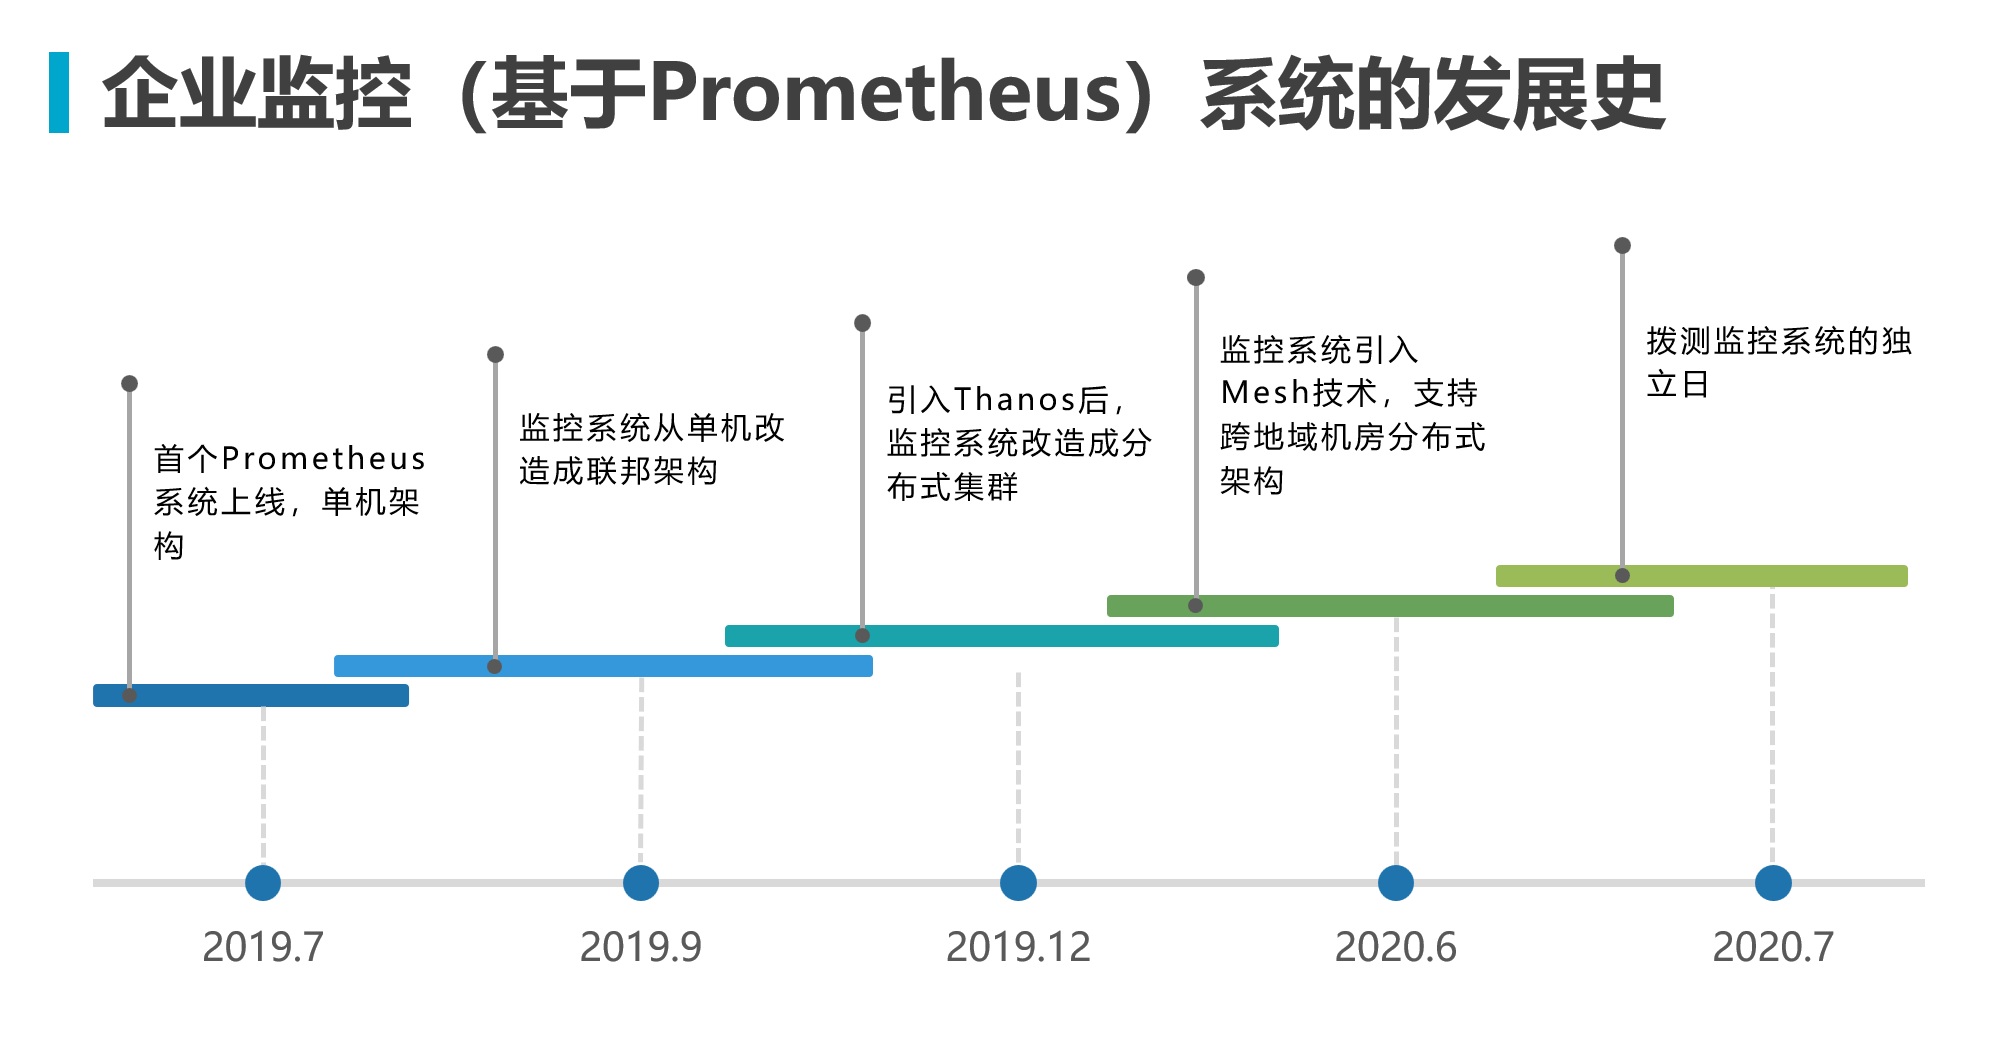
In “Monitoring System Enterprise Architecture Evolution — Cross-Region Hybrid Cloud”, the monitoring system had gradually matured and evolved toward enterprise-level capabilities. This chapter briefly describes the construction of the probing capability during this period. Below is the development history of this system. During the construction of the monitoring platform, internal monitoring collection alone was insufficient to meet enterprise business needs. Before planning APM development, remote probing with black-box monitoring was also incorporated as a subsystem.
Probing Monitoring Architecture Implementation
The system faced several challenges that needed to be addressed:
- For a long time, enterprises had blind spots in public network monitoring, even the user-side last mile monitoring, causing user-side business faults to go undetected until users reported issues. The black-box probing monitoring system project was launched precisely to solve this long-standing monitoring pain point.
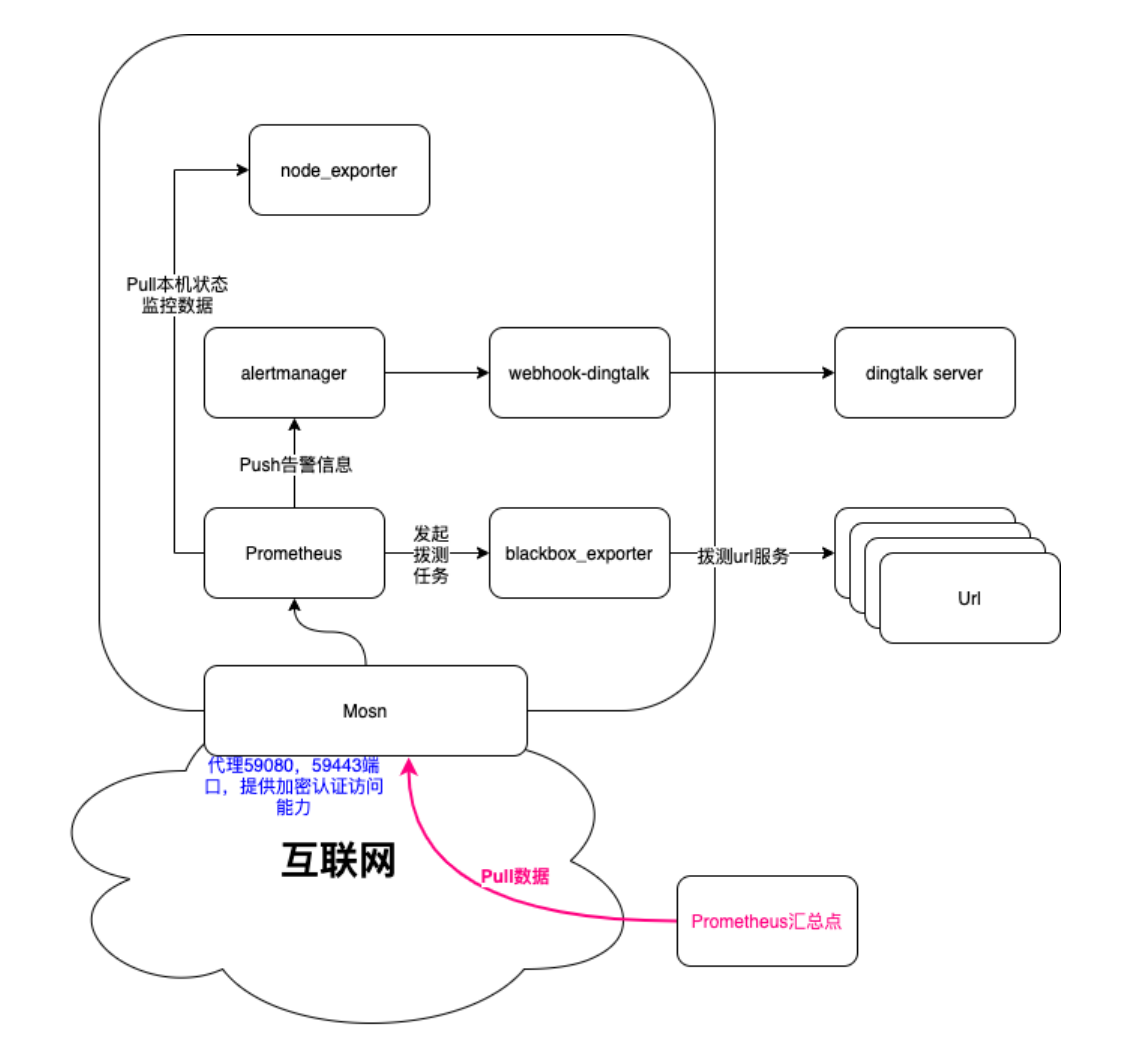
- Black-box monitoring tests service external visibility from the user’s perspective. Common black-box monitoring includes HTTP probes, TCP probes, etc., used to detect site or service accessibility and access efficiency. The probe design needed to support business interaction for more effective issue detection. Therefore, Prometheus + blackbox_exporter was chosen as the probe tool.
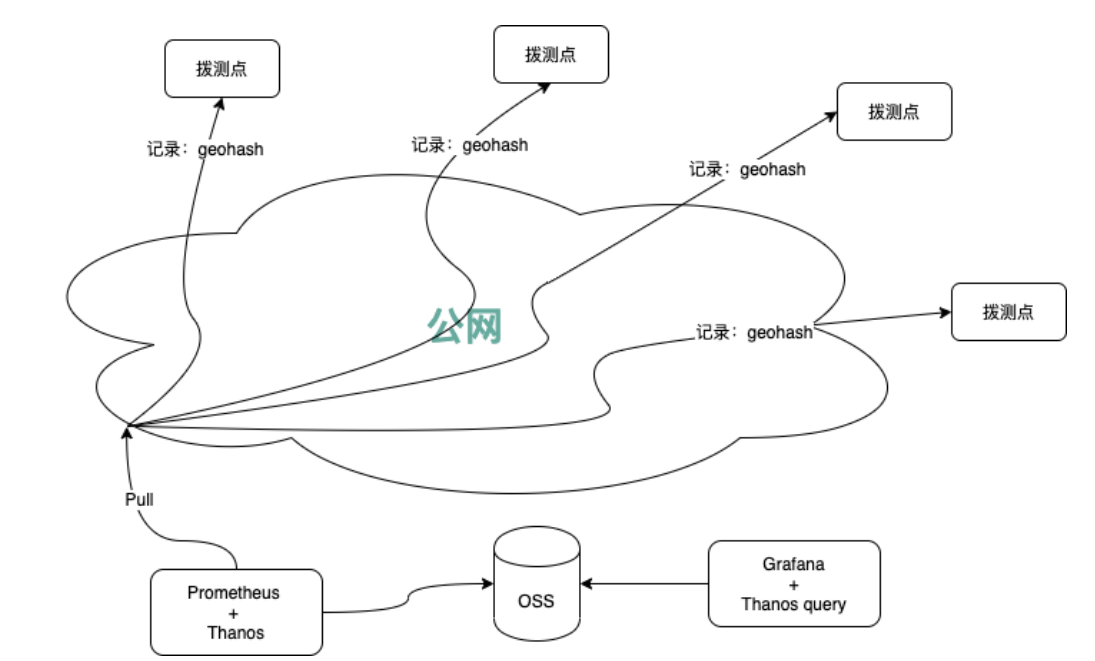
- Probing points needed to be deployed nationwide, making management difficult — especially while balancing probe task distribution, probe monitoring data collection for unified display, alert aggregation and convergence, while also considering security and audit requirements. The architecture needed to strictly control PULL and PUSH data flows while remaining independent from the existing collection monitoring system. Mosn was introduced for mesh management to reduce management costs.
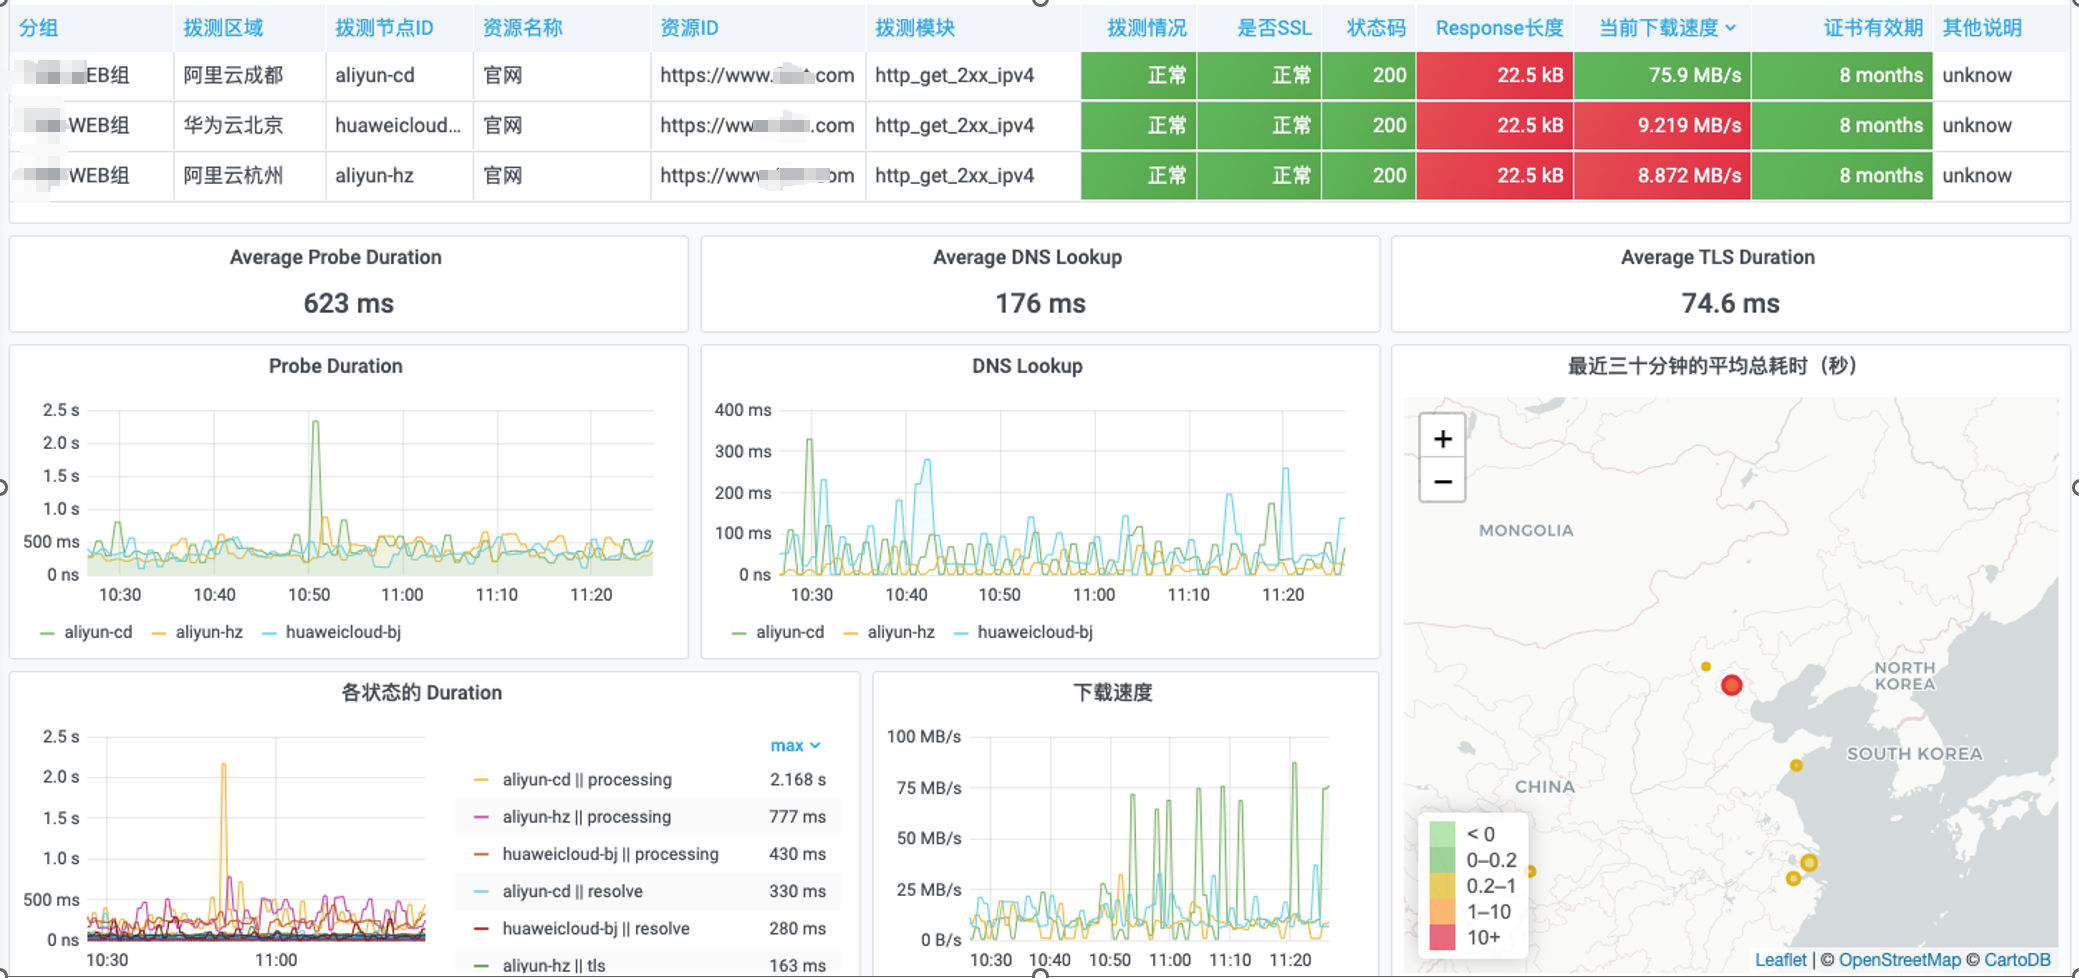
- The system’s default data display only used time series charts and tables. A clear geographic map would better illustrate the situation. To achieve geographic map display, geohash + OpenStreetMap was adopted.
Requirements and Features
The first phase of construction only covered basic requirements, but needed to meet the following conditions to achieve essential business needs:
- Support monitoring of the company’s frontend service certificate chain, DNS latency, TLS latency, initial connection establishment latency, page load completion latency, etc.
- Support ICMP probing for cross-domain internal/external network quality monitoring of production systems, especially cross-domain dedicated line quality.
- Support interactive monitoring for DNS, TLS TCP, SMTP protocols, etc., all applicable to CDN service scenarios, proxy service scenarios, and email system usage scenarios.
Since projects in the 0-1 phase typically struggle to secure deep enterprise investment, the first phase relied on open-source projects for construction, with gradual investment in component redevelopment for capability expansion.
Architecture Overview
First, each probing point was defined as an edge island. “Edge island” refers to its deployment location, far from the enterprise’s system datacenter. The cheapest virtual machine resources were purchased worldwide to deploy services, representing local probing requests.
geohash + OpenStreetMap was used to highlight regional quality data in alerts and chart displays.
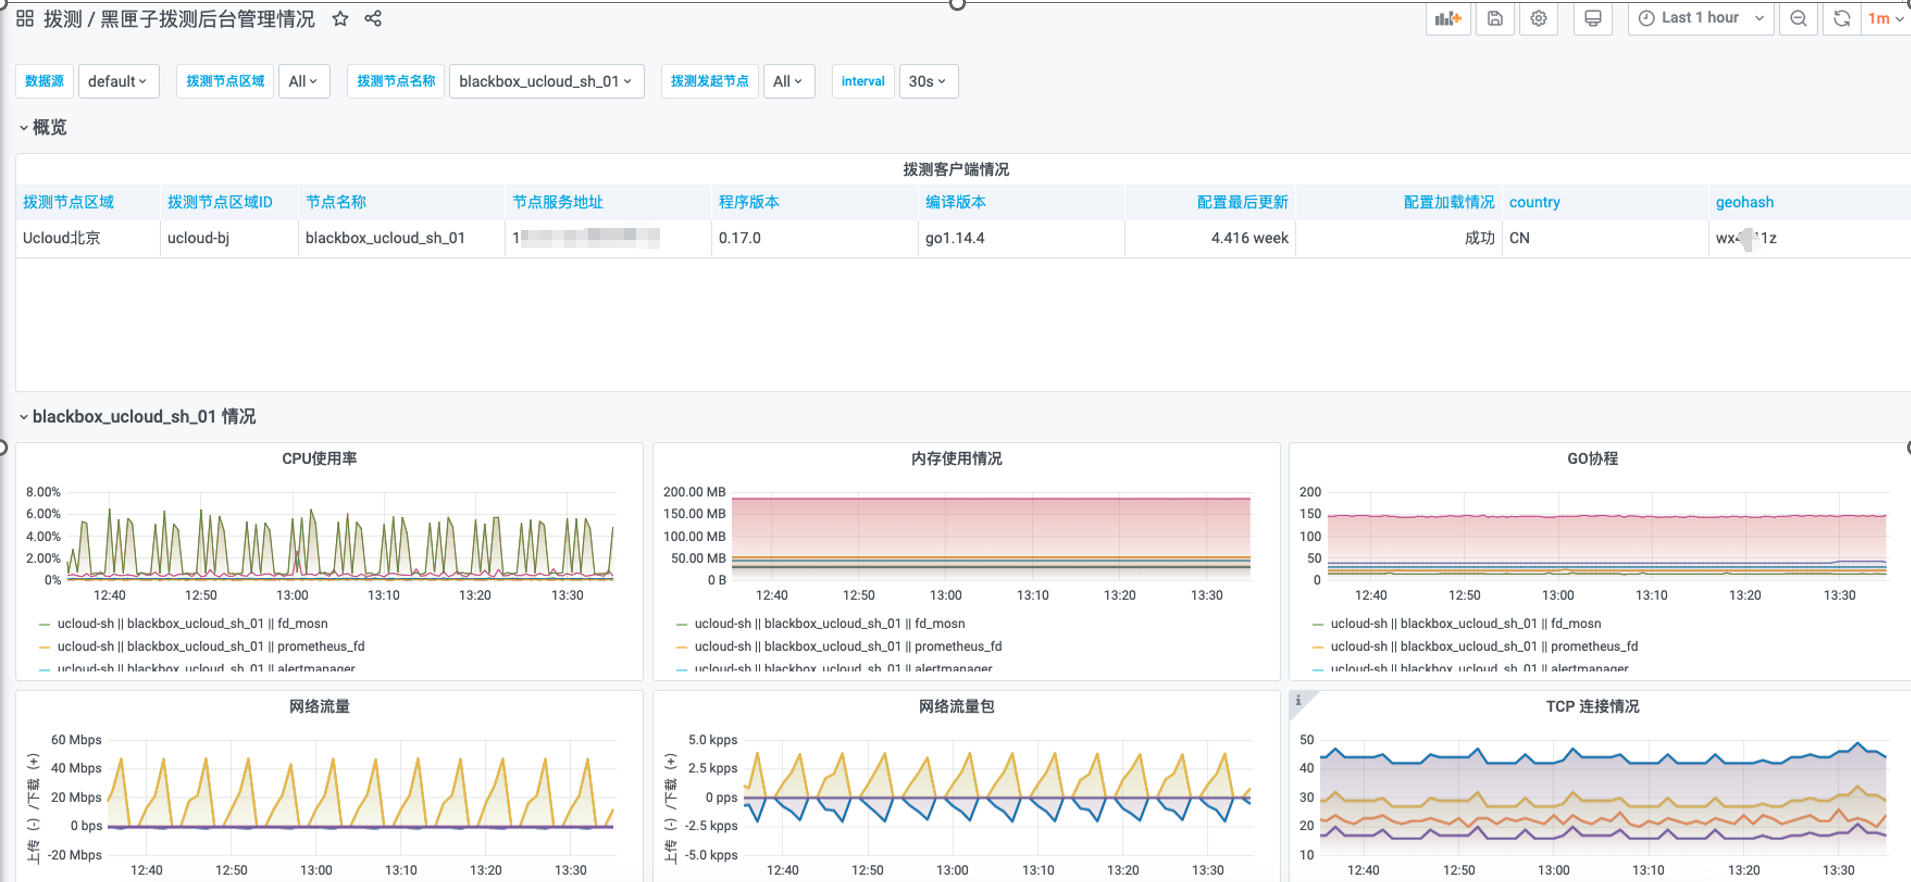
Each edge island probing node needed basic autonomous capabilities, including self-status monitoring, probe task initiation, and self-alerting policies. Below is the internal structure of a probing node. This structure can run on as little as 0.5 CPU cores and 512MB of memory. Later, resource utilization can be further consolidated through custom component development.
Results Display
Probing Global Overview
Probing Resource Usage
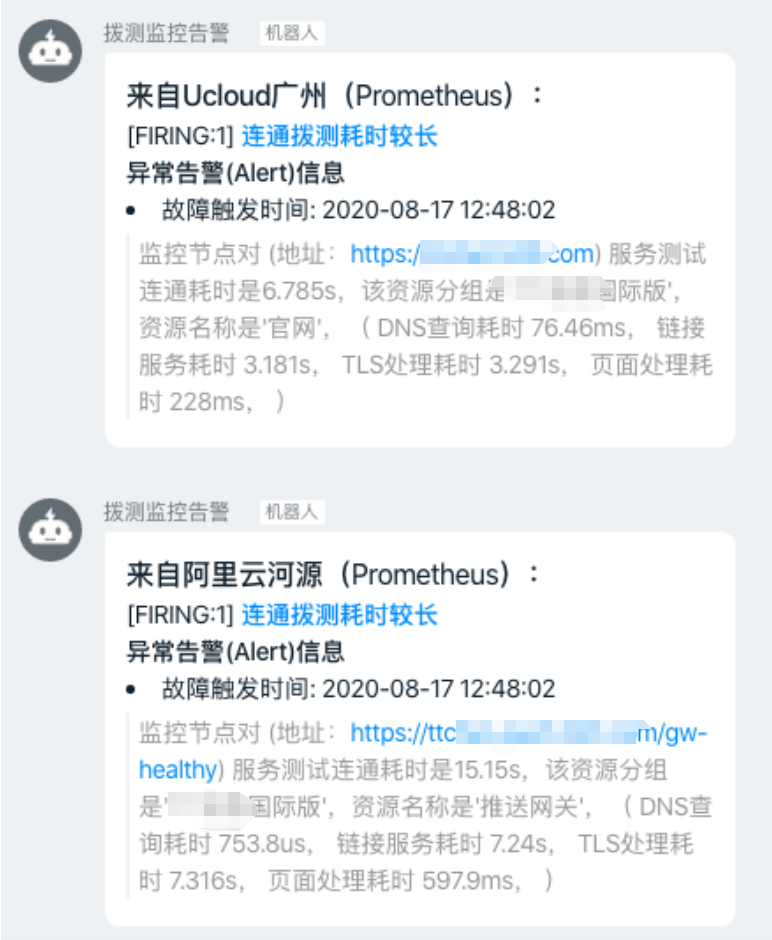
Alert Display