Monitoring System Enterprise Architecture Evolution — Cross-Region Hybrid Cloud
Recap
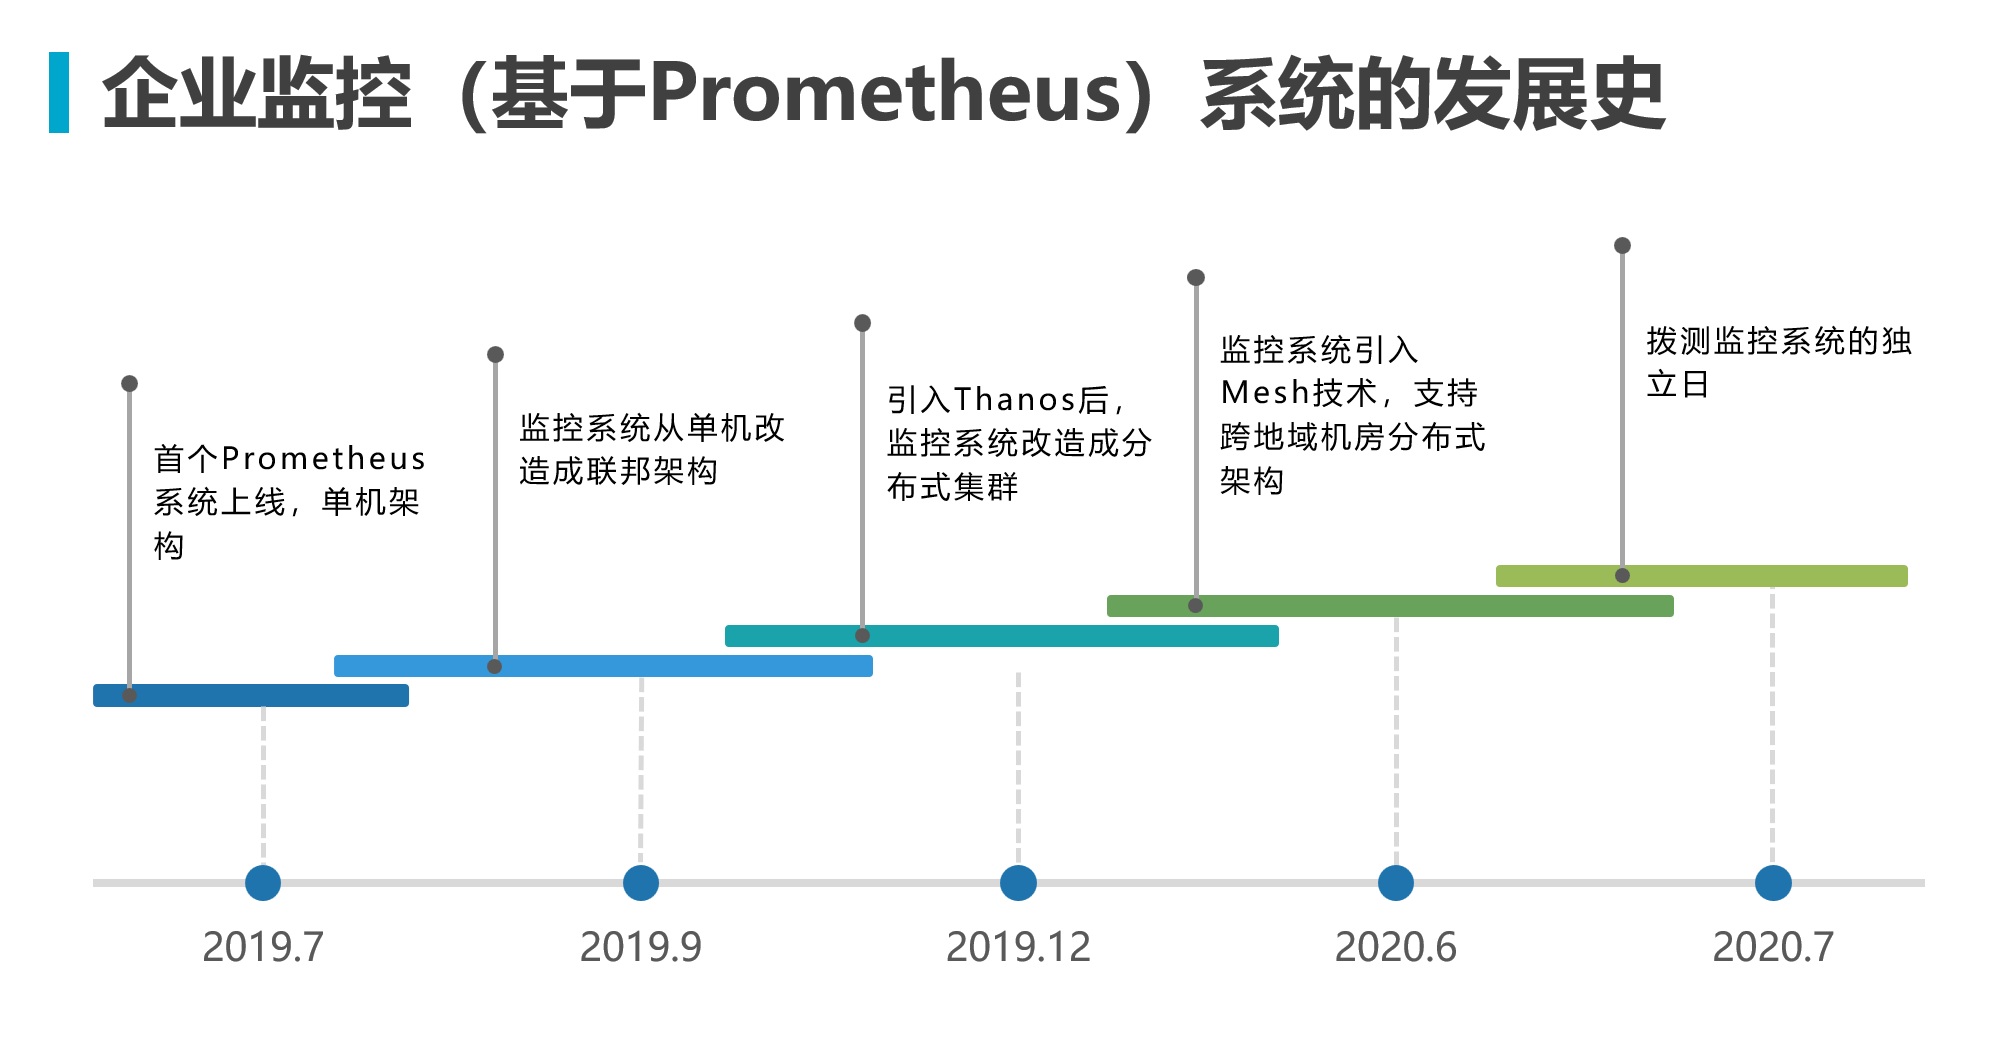
In “Monitoring System Enterprise Architecture Evolution — First Steps with Prometheus”, the monitoring system had already been upgraded from a single-node architecture to a single IDC distributed architecture.
The content of the previous article applies to both VM-based and container-based deployments. Prometheus is a product of the cloud-native era and is commonly used alongside Kubernetes, but Prometheus itself can also replace traditional monitoring solutions like Zabbix in non-Kubernetes environments.
In this article, we begin to use Kubernetes deployment to upgrade the entire monitoring system architecture, making it more flexible for cross-region hybrid cloud business scenarios.
Architecture Design
Three-Layer Cross-Region Structure Design
Design a three-layer regional structure while standardizing regional naming with labels for quick identification of service geographic details. In the third layer, Cluster and VPC are at the same level, representing services isolated within a cluster or a specific network segment.
flowchart TD
    TQR["Thanos Query<br/>Region Layer"] --> TQZ1["Thanos Query<br/>Zone A"]
    TQR --> TQZ2["Thanos Query<br/>Zone B"]
    TQZ1 --> P["Prometheus<br/>Cluster/VPC x4"]
    TQZ2 --> P
    classDef src fill:#bbdefb,stroke:#2196F3,color:#1B5E20
    classDef proc fill:#fff3e0,stroke:#FF9800,color:#BF360C
    classDef store fill:#c8e6c9,stroke:#4CAF50,color:#1B5E20
    class TQR src
    class TQZ1,TQZ2 proc
    class P store
The Region-layer Thanos Query aggregates the zones, which in turn connect to the Prometheus instances inside each cluster/VPC.
Using Thanos Query for the Initial Layered Architecture
Leverage Thanos’s GRPC communication protocol and aggregation query capabilities to achieve progressive data aggregation up to the top Thanos Query component, which then aggregates and computes the time series result set for frontend display.

Introducing Thanos Query Frontend for a Unified Frontend Query Entry
The Thanos Query Frontend component has the following configurable capabilities for query optimization, which should be adjusted based on actual conditions:
Time series vertical splitting For example, querying 15 days of data. Due to the large sample volume, reading raw data into memory can cause OOM issues. By splitting vertically — such as breaking a 15-day aggregation query into 6-hour chunks — the
Thanos Querycomponent initiates4 * 15concurrent queries to complete sample queries, aggregates result sets for different time periods, and releases memory promptly after each sub-query completes, efficiently optimizing resource utilization.Query result caching Cache result sets in memory or
RedisusingHASH KEYbased on the query statement and time range for reuse, reducing upstream pressure.

Leveraging Kubernetes for More Elastic Redundancy

Self-Developed Architecture Components
Based on native open-source projects, the architecture has basically achieved cross-region hybrid cloud capabilities. However, more is needed for enterprise daily management — a management architecture and frontend capabilities are required for it to be considered an enterprise-grade service.
Basic Design Logic
To make the entire architecture flexible and versatile, several components were designed:
Self-research service discovery— Interfaces with third-party systems such asCMDB,CICDto collect business system and asset information, calculates relationships between business systems and infrastructure, and schedules resource information to theP-sidcarcomponent based on geographic information.P-sidcar— ManagesPrometheusat the edge, receives nearby collector information fromSelf-research service discovery, provideshttp_sdtoPrometheusfor discoveringexportercollectors while achieving fine-grainedlabelinjection.msg route agent— Interfaces with Feishu, DingTalk and other communication services, synchronizes alert responsible persons fromConf/Rule Syncfor efficient last-mile targeted information push.A-sidcar— ManagesAlertmanagercluster configuration, synchronizes suppression policies in near real-time for more precise alert management.Conf/Rule Sync— Interfaces with various edge components, synchronizing status information and backend management policies in near real-time.
flowchart TD
    CMDB@{ shape: hex, label: "CMDB/CICD<br/>external systems" } -->|resource sync| SD["Service discovery<br/>+ owner routing"]
    CR@{ shape: doc, label: "Conf/Rule Sync<br/>config sync" } --> EDGE["Edge sidecar<br/>collection + alert mgmt"]
    SD --> EDGE
    EDGE -->|http_sd + config mgmt| P["Prometheus<br/>+ Alertmanager"]
    SD -->|push| IM["Feishu/DingTalk etc."]
    classDef src fill:#bbdefb,stroke:#2196F3,color:#1B5E20
    classDef proc fill:#fff3e0,stroke:#FF9800,color:#BF360C
    classDef spec fill:#f3e5f5,stroke:#9C27B0,color:#4A148C
    classDef store fill:#c8e6c9,stroke:#4CAF50,color:#1B5E20
    class CMDB src
    class SD,EDGE proc
    class CR,IM spec
    class P store
External systems feed resources and collection policies to the edge via service discovery; alert policies and responsible persons are pushed down by the config sync component, ultimately reaching IM platforms.
Advanced Extensions
The base design aims to be lean and streamlined without losing flexibility. On top of this, enterprise capabilities are gradually enriched through self-developed frontend services, middleware, and edge components.
- The service discovery component focuses on interfacing with various third-party systems, not limited to CMDB/CICD systems, but also work order systems or job systems.
- The alert component gradually evolves into a unified alert system platform, working with the service discovery component for more advanced dynamic alert scheduling.
- The configuration sync component and Grafana gradually converge into a frontend system, integrating management and display.

The user-side logical view of the entire system is shown below:

At this stage, the platform has reached a certain level of complexity, but the user’s understanding needs to be simplified.

Unified Alert System
Once a monitoring platform reaches a certain stage, the alert storm problem inevitably begins to trouble various technical support departments within the enterprise. Alert convergence governance becomes a priority. At this point, the alert component evolves from simply providing targeted alert push capabilities to gradually enriching surrounding capabilities.
flowchart TD
    CFG["Alert Config<br/>Silence/Inhibit<br/>Owner/On-duty"] -->|Rules| AG@{ shape: diam, label: "Alert Generation" }
    AG --> RC@{ shape: diam, label: "Receive/Group<br/>Dedup" }
    RC --> RT@{ shape: diam, label: "Alert Routing" }
    RT --> NT@{ shape: diam, label: "Alert Notification" }
    NT --> CH["Email/Feishu<br/>DingTalk/SMS<br/>Phone/Webhook"]
    classDef src fill:#bbdefb,stroke:#2196F3,color:#1B5E20
    classDef spec fill:#f3e5f5,stroke:#9C27B0,color:#4A148C
    classDef store fill:#c8e6c9,stroke:#4CAF50,color:#1B5E20
    class CFG src
    class AG,RC,RT,NT spec
    class CH store
Alert configuration and governance policies (silencing, inhibition, owner, on-duty) feed alert generation; after grouping, deduplication, and routing, notifications are dispatched to each messaging channel.