Replacing VMs with ESP32 for Network Probing — esp32-blackbox Project in Action
Why
I have several LANs in different locations around the city, roughly 10 km apart. To make these networks talk to each other, I used tools like NetBird, ZeroTier, and Cloudflare Tunnel to set up a cross-region virtual LAN.
The network was set up, but how to ensure stability? After all, these tunnels traverse the public internet with varying link quality. The most direct approach is to use Prometheus’s blackbox_exporter for probing — periodic HTTP requests, Pings, DNS queries — feeding results into a time-series database with alert rules, so problems are detected immediately.
But here’s the problem: blackbox_exporter needs to run on a machine. Spinning up a VM just for a probing service doesn’t justify the electricity and hardware costs. The Proxmox server at home already uses enough power; adding another machine is unnecessary.
I happened to have several ESP32 dev boards lying around. The ESP32 is designed for network connectivity — running HTTP requests and sending ICMP packets is well within its capabilities. Power consumption is minimal; it can run on USB power at a cost of a few cents per month in electricity. So this project was born: esp32-blackbox.
Overall Architecture
Let’s first look at where this system fits in the overall network monitoring picture:
graph TB
    A@{shape: hex, label: "Site A<br/>ESP32 + Router"}
    B@{shape: hex, label: "Site B<br/>ESP32 + Router"}
    C@{shape: hex, label: "Site C<br/>ESP32 + Router"}

    A <--> OV["Virtual Network Layer<br/>NetBird / ZeroTier / CF Tunnel"] <--> B
    B <--> OV
    C <--> OV

    A -->|":9090/metrics"| P@{shape: cyl, label: "Prometheus"}
    B -->|":9090/metrics"| P
    C -->|":9090/metrics"| P
    P --> G@{shape: doc, label: "Grafana"}

    classDef site fill:#bbdefb,stroke:#2196F3,color:#1B5E20
    classDef overlay fill:#fff3e0,stroke:#FF9800,color:#BF360C
    classDef store fill:#c8e6c9,stroke:#4CAF50,color:#1B5E20
    classDef view fill:#f3e5f5,stroke:#9C27B0,color:#4A148C
    class A,B,C site
    class OV overlay
    class P store
    class G view
Each site has an ESP32 that performs probing through its respective egress network. Prometheus scrapes metrics from each node’s port 9090, and Grafana handles visualization and alerting.
Cross-Region Networking Solution
A brief introduction to the networking tools used:
- NetBird: WireGuard-based mesh VPN, very low latency after P2P hole punching, convenient management interface
- ZeroTier: Software-defined Layer 2 virtual network, decent stability, good as a backup link
- Cloudflare Tunnel: Reverse proxy tunnel, doesn’t require a public port to expose internal services, suitable for scenarios where P2P isn’t supported
The benefit of a three-layer networking approach is mutual redundancy. If NetBird goes down, ZeroTier takes over; if neither works, Cloudflare Tunnel provides a safety net. But more redundancy means more links to monitor — and that’s exactly where ESP32 probing shines.
ESP32 Blackbox Project Introduction
Project URL: github.com/Mi-Bee-Studio/esp32-blackbox
Hardware Selection
Currently supports two chips:
| Chip | Recommended Board | Features |
|---|---|---|
| ESP32-C3 | SuperMini | Cheap, ~$1.5 on AliExpress |
| ESP32-C6 | XIAO ESP32C6 | Supports WiFi 6, better performance |
I’m using the ESP32-C3 SuperMini, which is more than sufficient for this project.
Supported Probe Types
| Protocol | Description |
|---|---|
| HTTP/HTTPS | GET/POST requests, status code validation |
| TCP | TCP connection test |
| TCP+TLS | TLS handshake timing |
| DNS | DNS resolution test |
| ICMP Ping | Native socket implementation, RTT measurement |
| WebSocket/WSS | WS connection test |
Basically everything blackbox_exporter can do.
Zero Configuration on First Boot
I’m quite satisfied with this design. On first power-up, the ESP32 automatically enters AP mode. Connect your phone to the ESP32_Blackbox hotspot (password 12345678), open a browser to 192.168.4.1 and configure the WiFi. After saving, it reboots and connects automatically — no serial console needed.
flowchart TD
    A["Power on"] --> B@{shape: diam, label: "WiFi creds<br/>in NVS?"}
    B -->|"No"| C["Enter AP mode<br/>configure WiFi via<br/>192.168.4.1"]
    C --> D["Save creds & reboot"]
    B -->|"Yes"| E["STA mode<br/>connect WiFi"]
    D --> E
    E --> F["Start probes / Web:80<br/>Metrics:9090"]

    classDef src fill:#bbdefb,stroke:#2196F3,color:#1B5E20
    classDef decision fill:#f3e5f5,stroke:#9C27B0,color:#4A148C
    classDef config fill:#fff3e0,stroke:#FF9800,color:#BF360C
    classDef running fill:#c8e6c9,stroke:#4CAF50,color:#1B5E20
    class A src
    class B decision
    class C,D config
    class E,F running
Web Management Interface
In STA mode, open a browser to the ESP32’s IP to access the management interface:
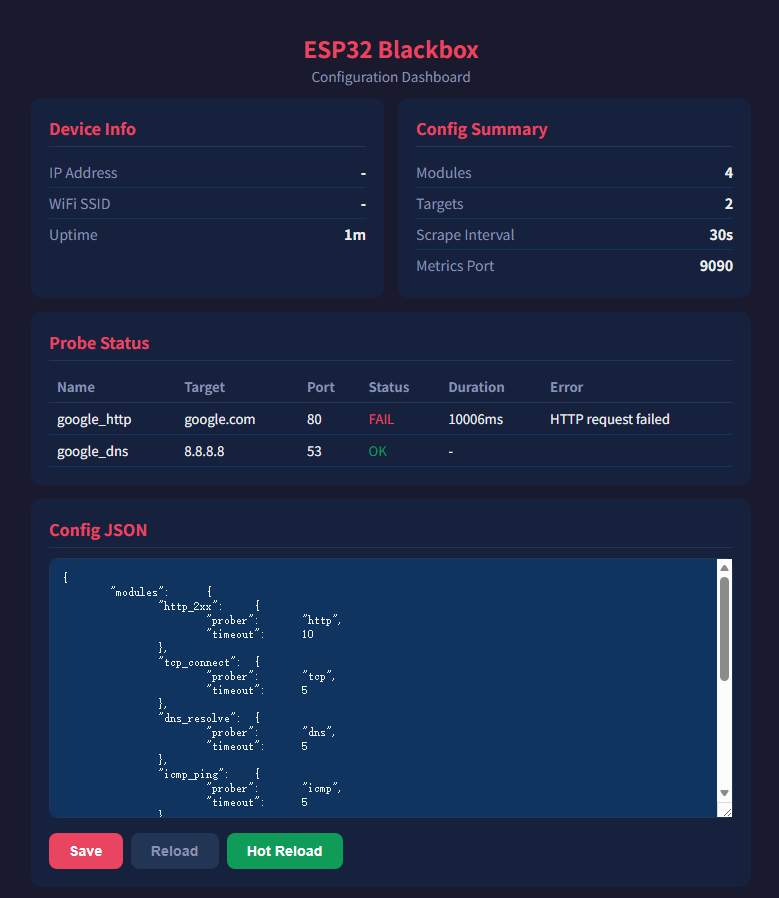
You can edit the JSON configuration directly on the interface and save it without recompiling the firmware. It also supports hot-reload — POST to /api/reload after changing the config and it takes effect immediately.
Configuration File Format
Probe targets are configured via JSON, stored in the SPIFFS filesystem:
| |
modules define probe behavior (protocol, timeout, validation rules), and targets define probe targets which reference module configurations via the module field. Want to add a new probe target? Just edit the JSON — no need to touch the code.
Prometheus Integration
ESP32 Blackbox is fully compatible with Prometheus’s scraping model. The /metrics endpoint outputs standard Prometheus text format:
| |
Configure a scrape job in Prometheus:
| |
The second approach uses the /probe endpoint, identical to how the original blackbox_exporter works. You can even take your existing Prometheus config pointing to blackbox_exporter, change the IP to point to the ESP32, and leave everything else unchanged.
Real Deployment
I placed several ESP32s at different sites, each configured with different probe targets:
- ESP32 at Site A probes services at Sites B and C
- ESP32 at Site B probes services at Sites A and C
- Site C follows the same pattern
This way, we have data on link quality between any two sites. A Grafana dashboard shows latency, packet loss, and HTTP success rates at a glance.
graph TD
    EA@{shape: hex, label: "ESP32 Node Cluster<br/>Site A / B / C<br/>mutual probing"}
    EA -->|":9090/metrics"| P@{shape: cyl, label: "Prometheus"}
    P --> G@{shape: doc, label: "Grafana"}

    classDef site fill:#bbdefb,stroke:#2196F3,color:#1B5E20
    classDef store fill:#c8e6c9,stroke:#4CAF50,color:#1B5E20
    classDef view fill:#f3e5f5,stroke:#9C27B0,color:#4A148C
    class EA site
    class P store
    class G view
Build & Flash
The project is based on ESP-IDF v6.0 and provides several build methods:
| |
If using ESP32-C6, just replace esp32c3 with esp32c6.
Summary
In short: I didn’t want to spin up another server just to run blackbox_exporter. An ESP32 costs a few dollars, consumes less than 1W of power, runs off a USB charger, and can be placed anywhere without a second thought.
The project is open source on GitHub — give it a try if you’re interested: Mi-Bee-Studio/esp32-blackbox