MiBeeSteward: Why I Built Another Device Management Tool in Go
As a studio operator, the biggest pain point is never a specific problem — it’s the “not knowing” when devices multiply.
Not knowing which devices are alive, what services are running on them, whether a new machine has appeared on the network, whether a certain port is still open. This accumulated “not knowing” eventually becomes an outage.
My previous approach was a patchwork: Zabbix for monitoring, Nmap for scanning, Excel for asset tracking, Prometheus for metrics. Each tool is fine on its own, but together they’re a disaster — data silos, duplicate configuration, version drift, complex deployment.
So I rebuilt it all in Go: MiBeeSteward. One binary covering device management, network discovery, protocol probing, and metrics monitoring in a single deployment.
The project is now open source: https://github.com/Mi-Bee-Studio/MiBeeSteward
What is MiBeeSteward
MiBeeSteward is a device management and monitoring system — its core mission is “knowing what’s happening on your network with minimal operational overhead.”
It’s not an NVR, nor is it an alerting platform. What it does is string together the entire device lifecycle — discovery → classification → monitoring → management — into a single binary.
Overall Architecture
flowchart TD
    SPA["SvelteKit 5 SPA"] --> ROUTER["Chi + Middleware"]
    ROUTER --> SERVICE["Service Layer"]
    SERVICE --> REPO["Repository & sqlc"]
    REPO --> SQLITE[("SQLite WAL")]
    SERVICE --> BG["Heartbeat 10s"]

    classDef front fill:#E3F2FD,stroke:#1565C0,color:#1565C0
    classDef svc fill:#FFF3E0,stroke:#E65100,color:#BF360C
    classDef data fill:#E8F5E9,stroke:#2E7D32,color:#1B5E20
    class SPA,ROUTER front
    class SERVICE,BG svc
    class REPO,SQLITE data
Standard DDD layered architecture: Handler → Service → Repository → SQLite. The SvelteKit 5 frontend is embedded via go:embed — deployment requires just a single file.
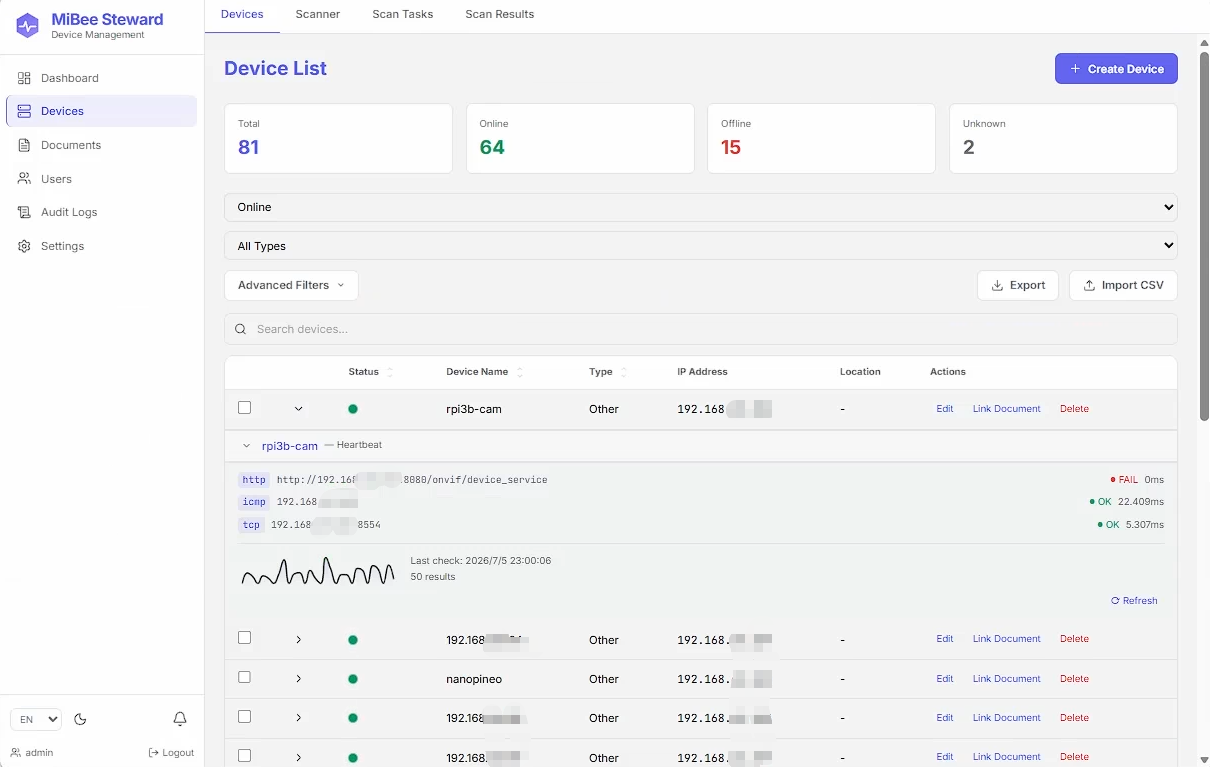
The device list page — summary cards (81 total / 64 online / 15 offline / 2 unknown) at the top, followed by a device table with heartbeat status, IP, type, and operations.
Tech Stack
| Layer | Choice | Rationale |
|---|---|---|
| Backend | Go 1.26+ / Chi v5 | Performance, cross-compilation, single binary |
| Database | SQLite (modernc.org/sqlite) | Pure Go, CGO_ENABLED=0, single file |
| Query Gen | sqlc | Type-safe, efficient development |
| Config | koanf/v2 | YAML + environment variable override |
| Auth | JWT (go-chi/jwtauth) | Cookie-first + Bearer fallback |
| Frontend | SvelteKit 5 + Tailwind 4 + ECharts | Small build output, responsive, lightweight embed |
| i18n | @inlang/paraglide-js | English + Chinese, compile-time inline |
| Probing | gosnmp / pro-bing / net/http | Native SNMP/ICMP/TCP/HTTP |
| eBPF | cilium/ebpf | Optional build tag, zero-dependency default |
Core Features Deep Dive
1. Multi-Protocol Probing (Probe Subsystem)
The most fundamental monitoring capability is “checking if a device is alive.” But different devices and scenarios require completely different probing methods.
MiBeeSteward uses an interface-based design with decorator pattern:
flowchart TD
    PROBER["Prober Interface"] --> ICMP["ICMP Ping"]
    PROBER --> TCP["TCP Connect"]
    PROBER --> HTTP["HTTP GET"]
    PROBER --> SNMP["SNMP v2c"]
    PROBER --> RETRY["RetryProber<br/>Decorator"]

    RETRY -->|"Exponential backoff 1s→2s→4s"| PROBE["Actual Probe"]
    PROBE -->|"3 consecutive failures"| STATUS["Mark Offline"]
    PROBE -->|"Responds again"| STATUS2["Mark Online"]

    classDef iface fill:#E3F2FD,stroke:#1565C0,color:#1565C0
    classDef impl fill:#FFF3E0,stroke:#E65100,color:#BF360C
    classDef logic fill:#E8F5E9,stroke:#2E7D32,color:#1B5E20
    class PROBER iface
    class ICMP,TCP,HTTP,SNMP impl
    class RETRY,STATUS,STATUS2 logic
Heartbeat monitoring uses a three-strike strategy: a device is only marked offline after 3 consecutive probe failures, preventing false positives from network jitter. Recovery is automatic — no manual intervention needed.
2. Plugin-Based Network Scanner v2 (Core Highlight)
This is MiBeeSteward’s most distinctive capability. Traditional network discovery tools fall into two camps:
- Scanners (Nmap, masscan): Port scanning only, no business context
- Monitors (Zabbix, Prometheus): Assume you already know what to monitor
MiBeeSteward’s Scanner v2 bridges this gap — it automatically identifies device types and services after scanning, using a 5-layer plugin architecture:
flowchart TD
    P1["① Probe"] --> P2["② Classifier"]
    P2 --> P3["③ ServiceHandler"]
    P3 --> P4["④ Persistence"]
    P4 --> P5["⑤ Orchestrator"]

    classDef step fill:#FFF3E0,stroke:#E65100,color:#BF360C
    class P1,P2,P3,P4,P5 step
The 5-layer architecture decouples discovery into independent plugin layers.
Classifiers support cascade deep collection, automatically discovering more services on each node:
flowchart TD
    CLS["Classifiers"] --> SSH["SSH"]
    CLS --> HTTP["HTTP"]
    CLS --> CAM["RTSP+ONVIF+SNMP"]
    HTTP --> COLL["Detect /metrics<br/>→ node_exporter<br/>→ CPU/memory"]

    classDef clsf fill:#E3F2FD,stroke:#1565C0,color:#1565C0
    classDef coll fill:#E8F5E9,stroke:#2E7D32,color:#1B5E20
    class CLS,SSH,HTTP,CAM clsf
    class COLL coll
Services detected out of the box:
| Classifier | Probe Method | Target | Additional Info |
|---|---|---|---|
| SSH | TCP port + magic bytes | SSH service | Version |
| HTTP | HTTP GET response | Web service / API | Server header, page title |
| RTSP | TCP port + protocol handshake | Camera / video stream | Supported methods |
| ONVIF | WS-Discovery multicast | ONVIF cameras | Model, vendor |
| SNMP | SNMP get | Network devices | sysDescr, OID, enterprise ID |
| Prometheus | HTTP /metrics endpoint | Prometheus targets | Metric list |
| node_exporter | Cascade detection | Host info | CPU/memory/disk/kernel |
Adding a new protocol takes three steps:
- Implement the
ServiceClassifierinterface (classify Evidence into ServiceIdentity) - Implement the
ServiceHandlerinterface (define deep collection behavior) - Register in
classify.DefaultClassifiers()andhandler.DefaultHandlers()
No changes needed to the Orchestrator or persistence layer.
3. eBPF Passive Observer
An experimental feature enabled via the build tag make build-with-ebpf (requires clang/llvm/bpftool + kernel BTF ≥ 5.8).
The TC ingress program attaches to a network interface and passively sniffs:
- ONVIF WS-Discovery multicast (239.255.255.250:3702) — discovers cameras on the network
- TCP magic bytes — identifies SSH, RTSP, HTTP protocol handshakes
Results serve as corroborating evidence at confidence 0.6, fused with active scan results. The default build uses a no-op stub — the binary has zero eBPF dependencies.
4. Device Systems Management
Each device can host multiple “systems” — essentially an additional layer of granularity on top of the device:
| |
Each system can independently expose a metrics endpoint, automatically discovered by Prometheus via /sd. The frontend displays them as a card grid with category badges (web_app, database, middleware, custom).
5. Native Prometheus Integration
MiBeeSteward doesn’t just “send data to Prometheus” — it is itself part of the Prometheus ecosystem:
/metrics— Standard Prometheus endpoint (Gauge / Counter / Histogram)/sd— HTTP service discovery endpoint, auto-exports all devices and device systems- Dashboard proxy —
/api/v1/dashboard/queryread-only proxy to query existing Prometheus
This means you can drop MiBeeSteward into your existing Prometheus + Grafana setup without additional exporters or relabel configuration.
Comprehensive Market Comparison
MiBeeSteward occupies a cross-domain intersection — it covers device asset management, network monitoring, network discovery, and the Prometheus ecosystem. Each domain has mature solutions, but MiBeeSteward cherry-picks the essential parts and packs them into a single binary.
Domain 1: Device Asset Management
| Feature | MiBeeSteward | NetBox | Device42 | Spreadsheet/GLPI |
|---|---|---|---|---|
| Deployment | Single binary | Python + PostgreSQL + Redis | Commercial appliance | Varies |
| Resource usage | < 100MB RAM | ~2GB+ RAM | Commercial | Varies |
| Auto-discovery | ✅ Scanner v2 plugin-based | ❌ Mostly manual | ✅ Auto-discovery | ❌ |
| Protocol probing | ✅ SNMP/ICMP/TCP/HTTP | ❌ | ✅ | ❌ |
| API | ✅ RESTful | ✅ RESTful | ✅ RESTful | ❌ |
| Frontend | ✅ SvelteKit SPA (embedded) | ✅ Django UI | ✅ Web UI | ❌ |
| Extensibility | Plugin-based Classifier + Handler | Plugin/Webhook | Commercial | N/A |
NetBox is the most popular open-source DCIM tool, but it’s fundamentally an asset management database — it doesn’t care whether devices are online or responding. MiBeeSteward takes the opposite approach: “is it alive?” is the core concern, with asset management as a byproduct.
Domain 2: Network Monitoring
| Feature | MiBeeSteward | Zabbix | Nagios | Checkmk | LibreNMS |
|---|---|---|---|---|---|
| Deployment | Single binary | Complex (Server/Proxy/DB/Web) | Complex | Server + Agent | PHP + MySQL |
| CGO required | ❌ No | ✅ Many C extensions | ✅ C deps | ✅ C deps | ✅ |
| Learning curve | Very low | High | High | Medium | Medium |
| Single host deploy | ✅ Out of the box | ❌ At least 3 components | ❌ Complex | ⚠️ Needs setup | ⚠️ Needs LNMP |
| Network auto-discovery | ✅ Scanner v2 | ✅ Network Discovery | ❌ | ✅ | ✅ |
| Prometheus integration | ✅ Native | ❌ Extra config | ❌ | ✅ | ⚠️ Limited |
| Resource usage | < 100MB | Varies (typically 1GB+) | Varies | Varies | Varies |
| SQLite | ✅ | ❌ Needs DB | ❌ Needs DB | ❌ Needs DB | ❌ Needs MySQL |
| Alerting | ❌ (Prometheus + Alertmanager) | ✅ Full-featured | ✅ Full-featured | ✅ Full-featured | ✅ Full-featured |
| History storage | ❌ (Prometheus short-term) | ✅ Built-in | ✅ Built-in | ✅ Built-in | ✅ RRD |
Key distinction: Zabbix/Nagios/Checkmk are “heavy monitoring platforms” — a full deployment requires database, web server, agents, alerting, and more. MiBeeSteward is not another Zabbix — it’s a KISS-principle device management tool with lightweight monitoring, suited for small to medium deployments.
Domain 3: Network Discovery & Topology
| Feature | MiBeeSteward Scanner v2 | Nmap | OpenNMS | Netdisco |
|---|---|---|---|---|
| Positioning | Discover + Identify + Manage | Pure scanner | Full stack | Network discovery |
| Plugin architecture | ✅ 5-layer plugin | ❌ NSE scripts | ⚠️ Limited | ❌ |
| Service inference | ✅ Auto-classify (camera/web/DB/SSH…) | ❌ Port-based guess | ❌ Config-driven | ✅ MAC/OUI |
| DL cascade discovery | ✅ Auto cascade deep collection | ❌ | ❌ | ❌ |
| eBPF passive | ✅ Optional | ❌ | ❌ | ❌ |
| Persistence | ✅ SQLite auto | ❌ Needs scripting | ✅ PostgreSQL | ✅ PostgreSQL |
| Deployment complexity | Low | Low | High | Medium |
Nmap is the undisputed king of network discovery, but its output is a flat list (open ports). You have to interpret the business meaning yourself. MiBeeSteward’s Scanner v2 tries to translate “open ports” into “this device is a camera, model is Hikvision DS-2CD2xxx, running RTSP and ONVIF”.
Domain 4: Prometheus Ecosystem Integration
| Feature | MiBeeSteward | Prometheus + node_exporter | Grafana |
|---|---|---|---|
| Role | Management + Monitoring unified | Metrics collection | Visualization |
| Device management | ✅ Native | ❌ Need external system | ❌ |
| Auto-discovery | ✅ /sd HTTP SD | ⚠️ file_sd / consul_sd | ❌ |
| Metrics exposure | ✅ Native /metrics | ✅ node_exporter | ❌ |
| End-to-end | ✅ Single binary | Needs Prometheus + node_exporter + Grafana | Needs Prometheus |
| Initial setup | ✅ 5 minutes | 30+ minutes | 15+ minutes |
MiBeeSteward fills a gap in the Prometheus ecosystem: device management and auto-discovery. Prometheus collects metrics, node_exporter exposes host metrics, Cortex/Thanos provides long-term storage — but who tells you what devices to monitor? That’s MiBeeSteward’s place.
Domain 5: NVR / Camera Platforms
| Feature | MiBeeSteward | Frigate | Shinobi | ZoneMinder | Scrypted |
|---|---|---|---|---|---|
| Positioning | Device management (incl. camera discovery) | AI NVR | Traditional NVR | Traditional NVR | HomeKit bridge |
| Recording | ❌ | ✅ MP4 segments | ✅ | ✅ | ✅ |
| AI detection | ❌ | ✅ Powerful (Coral TPU) | ⚠️ Plugin | ⚠️ Plugin | ✅ |
| Camera discovery | ✅ RTSP+ONVIF auto-detect | ❌ Manual config | ❌ Manual config | ❌ Manual config | ❌ Manual config |
| HomeKit | ❌ | ❌ | ❌ | ❌ | ✅ Native |
| Resource usage | < 100MB | ~500MB+ (with AI) | Medium | Medium | Medium |
MiBeeSteward is not an NVR — it doesn’t record video. But I chose to include RTSP/ONVIF classifiers because automatically identifying camera devices and brands during network scans is invaluable for operators wanting to know “what cameras are on my network.” For recording, pair it with MiBeeNvr from the same studio.
Summary Comparison
flowchart TD
    MS["MiBeeSteward"] --> CORE["Single Binary<br/>4 Domains"]
    CORE --> DM["Device Mgmt"]
    CORE --> NM["Network Monitor"]
    CORE --> ND["Network Discovery"]

    classDef ms fill:#FFF3E0,stroke:#E65100,color:#BF360C
    classDef core fill:#E8F5E9,stroke:#2E7D32,color:#1B5E20
    classDef dom fill:#E3F2FD,stroke:#1565C0,color:#1565C0
    class MS ms
    class CORE core
    class DM,NM,ND dom
MiBeeSteward spans three traditional domains. Here’s how it compares to specialized tools:
flowchart TD
    DM["Device Mgmt"] -->|"vs NetBox"| A["Asset DB only"]
    NM["Network Monitor"] -->|"vs Zabbix"| B["Heavy platform"]
    ND["Network Discovery"] -->|"vs Nmap"| C["Port semantics only"]

    classDef left fill:#FFF3E0,stroke:#E65100,color:#BF360C
    classDef right fill:#E3F2FD,stroke:#1565C0,color:#1565C0
    class DM,NM,ND left
    class A,B,C right
MiBeeSteward’s Differentiating Advantages
Looking at the comparisons above, MiBeeSteward isn’t the “most feature-complete” in any single domain — Zabbix has better alerting, NetBox has more structured asset management, Nmap has more comprehensive scanning. But MiBeeSteward’s strength lies in its positioning:
1. Unified Device Management Entry Point
Most teams have fragmented device management workflows:
- Device onboarding → Enter in NetBox (or jot down in Excel)
- Device monitoring → Add host in Zabbix
- Network scanning → Run Nmap, save XML
- Metrics collection → Set up Prometheus + node_exporter
MiBeeSteward collapses this into a single command: configure your subnet, click scan, and devices are automatically imported, classified, heartbeat-configured, and exposed to Prometheus.
2. Single Binary, Zero Dependencies
This is a natural advantage of pure Go + modernc.org/sqlite (CGO-free).
Compared to Zabbix (requires at least Server + DB + Web + Agent) or the Prometheus stack (Prometheus + node_exporter + Grafana + registry), MiBeeSteward targets the scenario of small teams with distributed devices who don’t want to maintain infrastructure.
| |
No database setup, no Nginx config, no Java/Python/Node runtime. ARM64-first design means it runs effortlessly on Raspberry Pis or mini PCs.
3. Scanner v2’s Unique Design
The plugin-architecture approach to network-discovery-as-a-service is rare in open source. The 5-layer decoupling means adding a new protocol requires writing just two small files (Classifier + Handler) — the other four layers are untouched.
The cascade deep collection is particularly unique — detecting HTTP triggers an automatic scan for /metrics, finding a Prometheus endpoint triggers automatic node_exporter detection, which in turn parses CPU/memory/kernel version. This “scan one, find a chain” capability has no equivalent in existing open-source tools.
4. eBPF Innovation
Although eBPF passive observation is experimental, the concept is valuable. Traditional network scanning is inherently active — you send probe packets. In sensitive environments (industrial control, medical devices), active probing may be blocked by firewalls or interpreted as an attack. eBPF passive sniffing provides a “listen-only” observation perspective.
Use Cases and Limitations
Best Suited For
- Studio / lab device management — 20-100 devices, need to know who’s alive and what services are running
- Edge server rooms — No dedicated ops staff, need minimal deployment
- IoT / embedded device clusters — ARM64 mini PCs, low resource consumption is mandatory
- Prometheus ecosystem supplement — Already have Prometheus but need device management and auto-discovery
- Camera network inventory — Quickly discover cameras on your network: brand, protocol, location
Not Suited For
- Large enterprise monitoring (>500 devices) — Zabbix/Checkmk/OpenNMS is more appropriate
- Full-featured alerting requirements — MiBeeSteward doesn’t alert; pair with Alertmanager
- Long-term history storage — Depends on Prometheus + Cortex/Thanos
- Pure NVR requirements — Use Frigate or MiBeeNvr
- Network performance monitoring (traffic analysis, latency jitter) — Not MiBeeSteward’s target
Roadmap
MiBeeSteward is in its early stages (just open-sourced). Planned directions include:
- More Scanner v2 classifiers — Modbus (industrial), MQTT broker, database direct detection
- Alert rule engine — Simple threshold evaluation on the device side
- Batch firmware/configuration management — Push via SSH/SNMP
- More eBPF probes — Network latency, packet loss, TCP retransmission observation
Final Thoughts
MiBeeSteward isn’t a project that aims to “replace” Zabbix or NetBox — its value for me lies in filling the gap between them.
Anyone who’s done ops knows the pain of a small team isn’t that a single feature isn’t powerful enough — it’s too many tools, too much scattered configuration, too heavy deployment. MiBeeSteward’s choice is to do the opposite: pack the essentials into a single binary. Download, run, it works.
The project is open source at https://github.com/Mi-Bee-Studio/MiBeeSteward , licensed under PolyForm Noncommercial (free for non-commercial use). If it helps with something you’re dealing with, a Star is the biggest encouragement.
If you have ideas or suggestions, feel free to open an issue for discussion.