Observability Series
Enterprise Monitoring Evolution 9 posts
MySQL Monitoring
MySQL Privilege Best Practices
Privilege control is primarily for security reasons, so follow these best practices:
- Grant only the minimum privileges needed to prevent users from doing harm. For example, if a user only needs to query, just grant SELECT privileges, not UPDATE, INSERT, or DELETE.
- Restrict the login host when creating users, typically to a specific IP or internal network IP range.
- Delete users without passwords after initializing the database. The installation automatically creates some users with no passwords by default.
- Set passwords that meet complexity requirements for each user.
- Periodically clean up unnecessary users. Revoke privileges or delete users.
Example:
Prometheus is an open-source monitoring and time series database system that has gained widespread adoption in recent years.
The official architecture diagram is shown below:
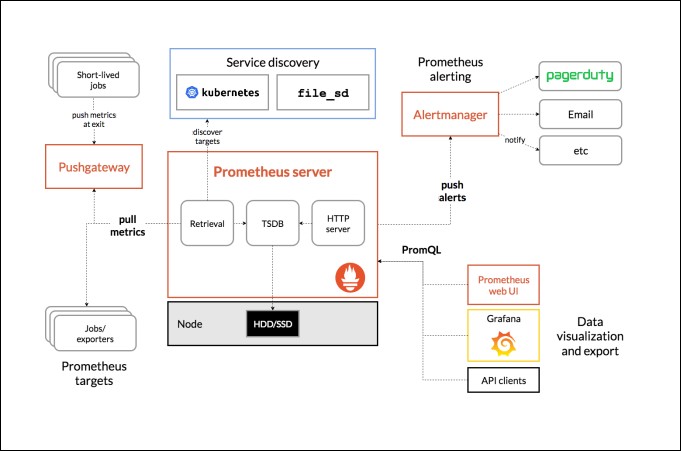
In the context of distributed internet services, high concurrency, and multi-cloud deployment, SRE (Site Reliability Engineering) has become a core role in ensuring service availability, and the monitoring system serves as SRE’s “eyes.” This article starts from SRE core principles, deconstructs the pain points of modern monitoring systems, technology stack selection, Prometheus core principles, and alerting best practices, presenting a practical enterprise-grade monitoring system construction methodology.
SRE Core Principles: Stability is the #1 Metric
SRE’s core is ensuring continuous service stability through engineering practices, focusing on capacity planning, cluster maintenance, fault tolerance, load balancing, and monitoring system construction. There are only 3 core measurement metrics:
Recap
In “Monitoring System Enterprise Architecture Evolution — First Steps with Prometheus”, the monitoring system had already been upgraded from a single-node architecture to a single IDC distributed architecture.
The content of the previous article applies to both VM-based and container-based deployments. Prometheus is a product of the cloud-native era and is commonly used alongside Kubernetes, but Prometheus itself can also replace traditional monitoring solutions like Zabbix in non-Kubernetes environments.
In this article, we begin to use Kubernetes deployment to upgrade the entire monitoring system architecture, making it more flexible for cross-region hybrid cloud business scenarios.
Recap
In “Monitoring System Enterprise Architecture Evolution — Cross-Region Hybrid Cloud”, the monitoring system had gradually matured and evolved toward enterprise-level capabilities. This chapter briefly describes the construction of the probing capability during this period. Below is the development history of this system. During the construction of the monitoring platform, internal monitoring collection alone was insufficient to meet enterprise business needs. Before planning APM development, remote probing with black-box monitoring was also incorporated as a subsystem.
In the full-link monitoring system of internet services, white-box monitoring focuses on proactively uncovering potential issues and predicting risks, while black-box monitoring is fault-oriented, rapidly detecting problems that have already occurred online. The two work together to form a complete monitoring closed loop. Most internet companies have long had a monitoring blind spot for public network services and the user-side last mile. User-side faults often only trigger investigation after users report issues. The black-box probing monitoring system was designed precisely to solve this industry pain point.
In the context of rapid internet business expansion, multi-cloud deployment, and exponential asset growth, the monitoring platform is a critical infrastructure for ensuring service stability. This article provides a complete review of a major internet company’s monitoring platform evolution from 2019 to 2021 — from solving legacy monitoring performance bottlenecks, to implementing cross-cloud distributed monitoring, to cloud-native platform governance — presenting the full transformation of the monitoring system from 0 to 1 build → large-scale expansion → platform governance.
In the context of global business expansion and large-scale hybrid cloud deployment, cross-IDC, cross-border, multi-cloud heterogeneous monitoring governance has become a core challenge for stability assurance. Traditional monitoring solutions either rely on expensive dedicated line upgrades that intrude on business architecture, or cannot balance node autonomy with global unification. Meanwhile, as a non-revenue infrastructure, the monitoring system must strictly control resource usage without allowing capability degradation.
This article breaks down a practical cross-region monitoring system governance solution from a real internet company, explaining how to achieve elastic scaling, cross-border coverage, node autonomy, and data unification for the monitoring system without modifying business architecture or incurring business cross-domain costs.
In the context of multi-cloud deployment, global networking, and exponential growth in service scale within internet businesses, monitoring platforms have long surpassed the basic “metric collection + alert notification” positioning, becoming the core infrastructure for ensuring end-to-end stability. This article, based on the real evolution of a large-scale internet enterprise monitoring platform, dissects the complete planning and implementation approach for upgrading the monitoring platform from large-scale coverage to productization, usability, and intelligence in 2022.
Observability Storage 8 posts
Introduction
Observability has become a core infrastructure pillar of the cloud-native era. The five signals—Metrics, Logs, Traces, RUM, and Profiling—each generate massive volumes of data, and their storage efficiency directly determines platform cost boundaries and query performance. On the collection side, eBPF technology is reshaping how data is acquired. Behind all of this, storage architecture evolution is the foundation that enables observability to scale in production.
flowchart TD
    A[Five Signals of<br/>Observability] --> B[Metrics]
    A --> C[Logs]
    A --> D[Traces]
    A --> E[RUM + Profiling]

    style A fill:#9C27B0,color:#fff
    style B fill:#2196F3,color:#fff
    style C fill:#2196F3,color:#fff
    style D fill:#2196F3,color:#fff
style E fill:#2196F3,color:#fffflowchart TD
G[Storage Evolution<br/>Convergent Paths] --> H[Proprietary Format<br/>→ Columnar Standard]
G --> I[Index Bloat<br/>→ Weak Index + Object Store]
style G fill:#FF9800,color:#fff
style H fill:#4CAF50,color:#fff
style I fill:#4CAF50,color:#fffFigure: The five observability signals each produce data with different characteristics, yet their storage evolution converges on two core themes across all signals: the shift from proprietary storage formats to Parquet/Arrow columnar standards, and the move from full-field inverted indexes to weak-index strategies with object storage.
Introduction
Time-Series Databases (TSDB) are the foundation of observability storage. If the previous post was a bird’s-eye view of the “storage map,” this one zooms into the “core districts” — the storage engines of four mainstream TSDBs. Whether you’re just starting with Prometheus or evaluating VictoriaMetrics, understanding the design philosophy behind these storage engines will help you use them more effectively.
Quick Reference — Four TSDBs at a Glance
Database Positioning One-Liner InfluxDB Dedicated TSDB The earliest popular TSDB; custom TSM engine (1.x/2.x), pivoted to columnar storage in 3.0 Prometheus Cloud-native monitoring standard Built-in local TSDB, single-node design, widely adopted in the Kubernetes ecosystem VictoriaMetrics High-performance alternative Prometheus-compatible but more memory-efficient, supports clustering, excellent cold data compression TimescaleDB PostgreSQL time-series extension Don’t want to learn a new query language? Use Postgres + time-series optimizations If terms like “LSM-Tree,” “Compaction,” or “inverted index” sound unfamiliar — don’t worry. This post starts from the ground up, explaining what each storage engine is designed to solve.
Introduction
Logs generate the largest data volume and highest storage cost among the three pillars of observability. Unlike metrics with their fixed numeric structure, logs are variable-length text with semi-structured characteristics, posing unique storage design challenges: supporting full-text search while controlling storage costs.
The core design dimension of log storage systems is indexing strategy — deeper indexing means faster search, but also higher storage costs. From Elasticsearch’s full inverted index to Loki’s label-only indexing, each system makes different technical choices along this spectrum.
Distributed tracing storage is one of the most technically divergent areas in the observability landscape. Unlike metrics and logging, which have relatively converged storage patterns (TSDB and ClickHouse-like systems), tracing storage has split into three distinct paths due to fundamental disagreements over indexing strategy.
This chapter analyzes the storage architectures of Jaeger, Grafana Tempo, Apache SkyWalking, Zipkin, and the commercial solutions from Datadog and Splunk, concluding with a horizontal comparison.
Real User Monitoring (RUM) differs fundamentally from backend monitoring in its data model: RUM collects event streams with massive high-cardinality attributes — every user visit generates session_id, user_id, page_url, and hundreds of dimensions. Traditional TSDB label-set models degrade severely under this pattern.
This article analyzes the time-series storage design of three mainstream RUM solutions: Sentry (open-source all-in-one), Datadog RUM (SaaS benchmark), and Grafana Faro (Grafana LGTM ecosystem extension). The common trend across all three is leveraging columnar OLAP instead of TSDB.
Continuous Profiling is a vital pillar of observability. Unlike traditional sampling profilers, continuous profiling captures application and kernel stack traces at a fixed frequency around the clock, generating flame graphs that help teams identify performance bottlenecks, memory leaks, and resource hotspots. This article focuses on the storage architecture of profiling data: starting from the Google pprof data model and flame graph construction algorithm, we analyze Pyroscope’s architectural evolution from V1 (TSDB+Parquet) to V2 (Metastore+Segments), Parca and FrostDB’s columnar storage innovation, commercial solutions from Datadog and Splunk, and conclude with comparative tables that highlight the differentiating choices across solutions.
Observability architecture has undergone a profound shift from “fragmented” to “unified” over the past five years. Signals (metrics, logs, traces, profiling) have moved from independent specialized backends toward shared storage and a unified data model, while eBPF, as a next-generation collection mechanism, provides unprecedented data depth and breadth for this transformation. This article focuses on four dimensions: eBPF collection storage design, unified storage architecture (LGTM fragmented vs ClickHouse unified), the OpenTelemetry unified data model, and the evolution of object storage with compute-storage separation.
The previous 7 articles in this series analyzed the storage architectures of each observability domain—TSDB, logging, tracing, RUM, profiling, and eBPF—in depth. This article synthesizes that knowledge into a scenario-driven storage selection decision framework. Teams differ in scale, tech stack, budget, and requirements—there is no “best” storage, only the one that best fits your context. Use this article as a practical reference to quickly narrow down your options.
Beginner Analogy: Choosing observability storage is like choosing a vehicle — there’s no “best” car, only the one that fits your journey. A startup needs a cost-efficient compact (Loki + VictoriaMetrics); an enterprise with compliance needs a heavy-duty truck (Elasticsearch); a platform team wants a versatile van (ClickHouse unified). The key dimensions: data volume, query patterns, budget, and team size.
eBPF 7 posts
eBPF (Extended Berkeley Packet Filter) started as a network packet filtering tool, but over nearly a decade it has evolved into the most powerful observability framework in the Linux kernel. It allows you to safely inject and execute custom programs without modifying kernel source code or loading kernel modules.
This article kicks off the series, using OOM (Out-of-Memory) monitoring as a concrete entry point to learn the core eBPF concepts and toolchain.
bpftrace is great for quick probing and ad-hoc debugging. For production-grade monitoring tools, you need full eBPF programs. The architecture splits into two layers:
- Kernel side: eBPF program written in C, attached to hook points, collecting event data
- User side: loader written in Go (or Rust / libbpf C), loading the eBPF program and reading events
Architecture
flowchart TD
    classDef kern fill:#E3F2FD,stroke:#1565C0,color:#1565C0
    classDef user fill:#FFF3E0,stroke:#E65100,color:#BF360C
    classDef data fill:#E8F5E9,stroke:#2E7D32,color:#1B5E20

    subgraph kernel["Kernel Space"]
        hook@{ shape: rounded, label: "oom_kill_process (kprobe)" }
        ebpf@{ shape: proc, label: "eBPF Program\nEvent Collection" }
        ring@{ shape: cyl, label: "Ring Buffer" }
    end

    subgraph userspace["User Space (Go)"]
        loader@{ shape: notch-rect, label: "bpf2go Loader" }
        reader@{ shape: proc, label: "RingBuf Reader\nEvent Parsing" }
    end

    hook --> ebpf --> ring
    ring --> reader
    loader -.-> ebpf

    class hook,ebpf,ring kern
    class loader,reader user
eBPF Kernel Program (C)
Name the C file oom_kprobe.bpf.c — the bpf suffix is a cilium/ebpf convention for bpf2go code generation:
The first two articles covered eBPF fundamentals and OOM Killer event tracing. This article goes deeper: container-level OOM pinpointing, real-time memory allocation rate tracking, and implementing the same functionality with the Rust Aya framework.
Container-Level OOM Pinpointing
In Kubernetes, “a Pod OOM’d” is actually a vague statement. A Pod consists of multiple containers, each belonging to different cgroups. eBPF can drill through this layer and precisely identify which container and which process caused the OOM.
The previous articles showed how to use eBPF to observe OOM events. But we could only watch, not intervene. The kernel’s OOM Killer decides who lives and dies based on the oom_badness() algorithm, with no user control.
In 2025, Google engineer Roman Gushchin proposed the BPF OOM kernel patch series, aiming to let eBPF programs fully take over OOM handling policy. This is the biggest change to Linux memory management’s OOM subsystem in nearly two decades.
- Overview:
- How to Analyze a Protocol (MongoDB)
- Extending Protocol Parsing in
DeepFlow Agent - Extending DeepFlow Protocol Collection Using
WasmPlugins - Conclusion
- Appendix
Overview
MongoDB is widely used today, but lacks effective observability capabilities.
DeepFlow is an excellent solution for observability, but it lacks support for the MongoDB protocol.
This article extends DeepFlow with MongoDB protocol parsing, enhancing observability in the MongoDB ecosystem. It briefly describes the process from protocol document analysis to implementing code parsing within DeepFlow.
Deployment process and instructions reference: pixie install
Pixie Platform Main Components
Pixie Edge Module (PEM): Pixie’s agent, installed per node. PEMs use eBPF to collect data, which is stored locally on the node.
Vizier: Pixie’s collector, installed per cluster. Responsible for query execution and managing PEMs.
Pixie Cloud: Used for user management, authentication, and data proxying. Can be hosted or self-hosted.
Pixie CLI: Used to deploy Pixie. Can also be used to run queries and manage resources like API keys.
The previous articles on OOM tracing all used C for eBPF kernel-space programs. This is natural — C is eBPF’s “native language,” with the verifier, CO-RE, and libbpf toolchain all designed around C. But if you’ve followed the eBPF ecosystem, you’ll notice a clear trend: more and more people are writing eBPF in languages other than C. Rust’s Aya framework is already used in production by the Solana validator and Kubernetes Gateway API; meanwhile, Zig is trying to bring a new development experience with comptime, explicit allocation, and first-class C interop.