监控系统企业架构演进史-初入Prometheus
Prometheus是一个开源的监控与时间序列数据库系统,在近年来得到了越来越广泛的应用。
官方的架构图如图所示:
 本系列文章会以
Prometheus的在一个企业里的部署架构演进过程中逐步理解和深入各种组件和概念。
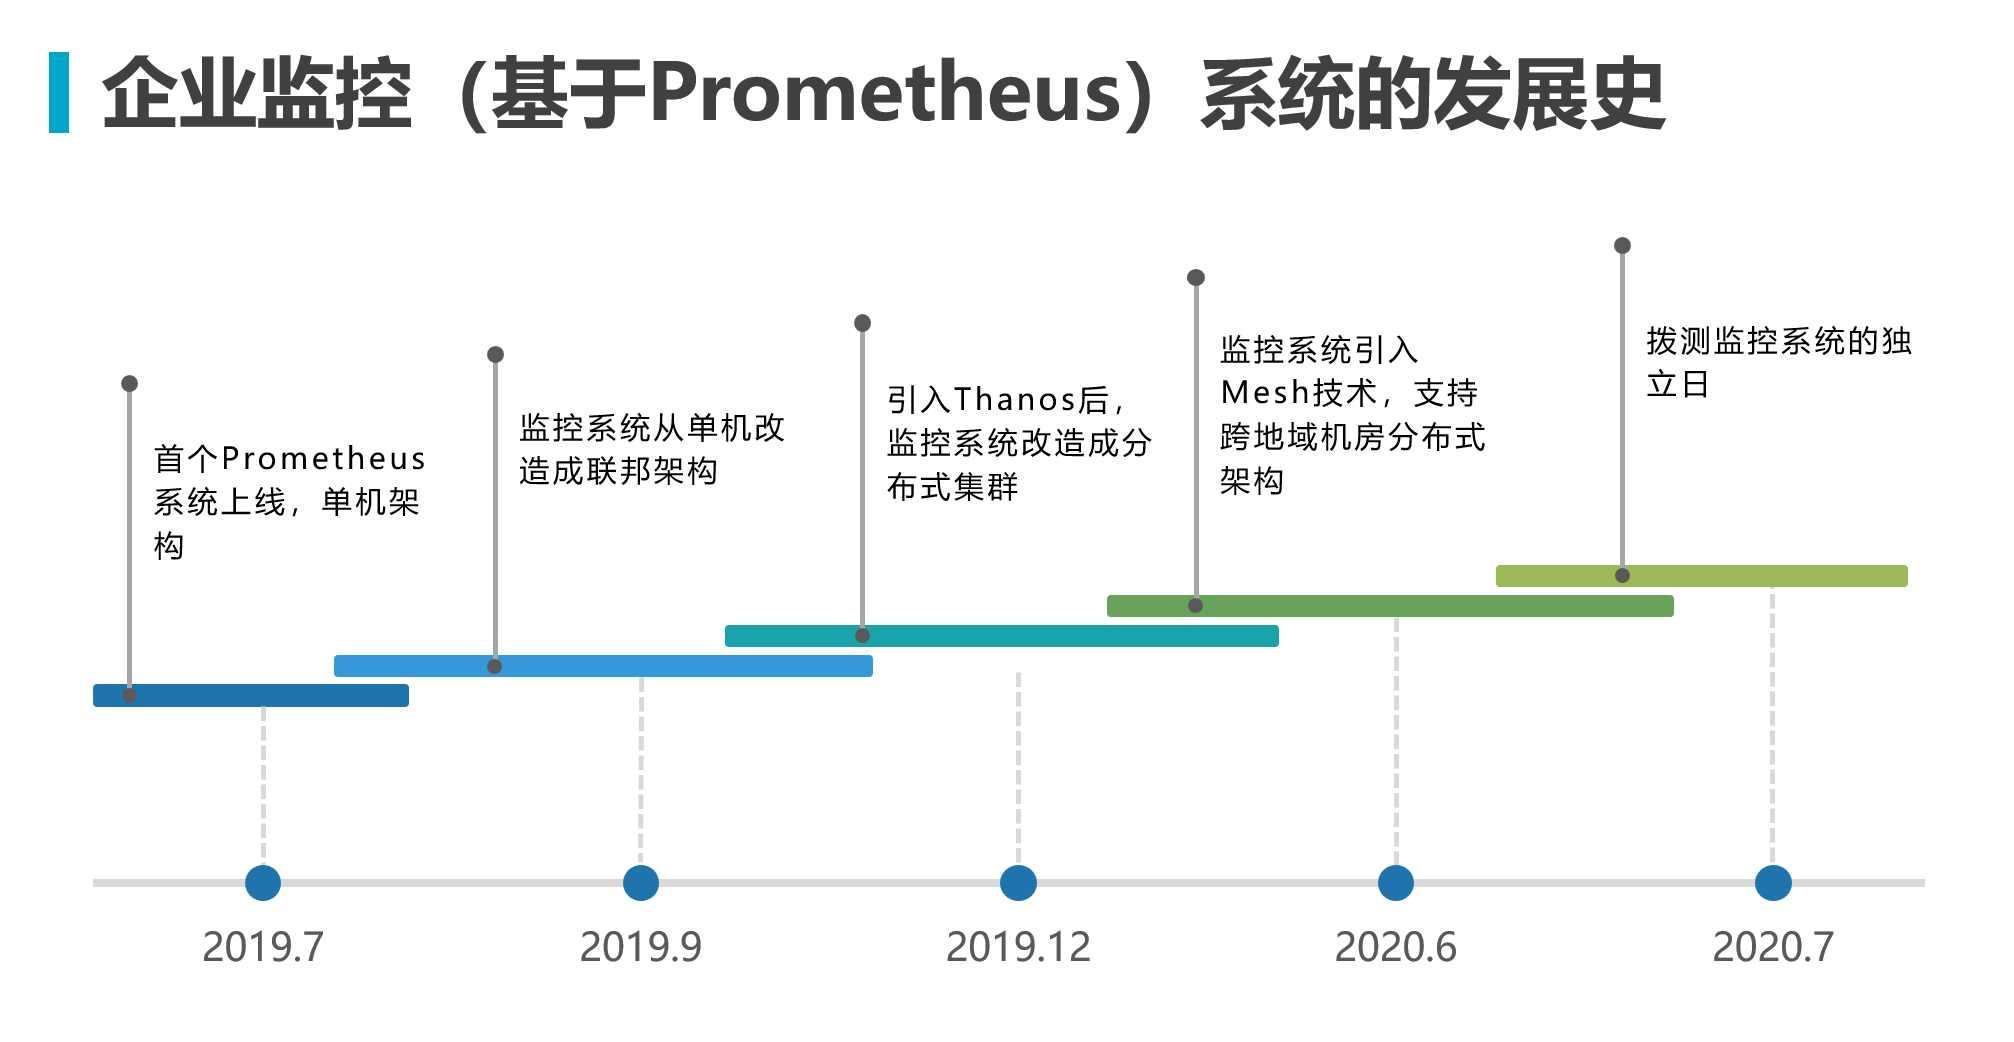
先通过下图简单了解这个演进发展史
单节点架构
刚开始接触Prometheus监控体系,只需要在服务端部署Prometheus的二进制文件,用最基础的文件服务发现配置file_sd_config来实现对主机基础监控node_exporter进行拉取指标采集即可。
再通过Grafana的datasource配置Prometheus的url地址即可开始配置查看监控数据。

指标数据采集
Prometheus的数据模型主要由Metric、Label和 Sample组成。
Metric:
- 表示一个时序指标,对应于一个监控指标名称。如cpu_usage、free_memory等。
- Metric仅包含时序数据名称,没有预定义的结构或类型。这使Prometheus具有很高的灵活性。
- 一个Prometheus实例可以包含任意数量的Metric。
Label:
- 用来描述和区分相同Metric的数据。类似于其他时序数据库的Tag。
- Label通常表示数据的维度或属性,如instance、job、region等。
- 每个样本数据都必须包含相同的Label集。Label用于快速查询和聚合特定维度的数据。
- Label的值可以是字符串、布尔值或整数。支持在Label上过滤和分组数据。
Sample:
- 表示一条时序数据,包含Timestamp、Value和Label集。
- Timestamp表示时序数据的时间戳,精度为毫秒。它用于排序和查询给定时间范围的数据。
- Value表示时序指标的值,可以是浮点数、整数或字符串。
- Label集用于标识该Sample数据的属性与维度。相同Label的Sample表示同一指标的不同记录。
一个Prometheus Sample包含:
| |
例如:
| |
如下所示是采集到的数据结构样例
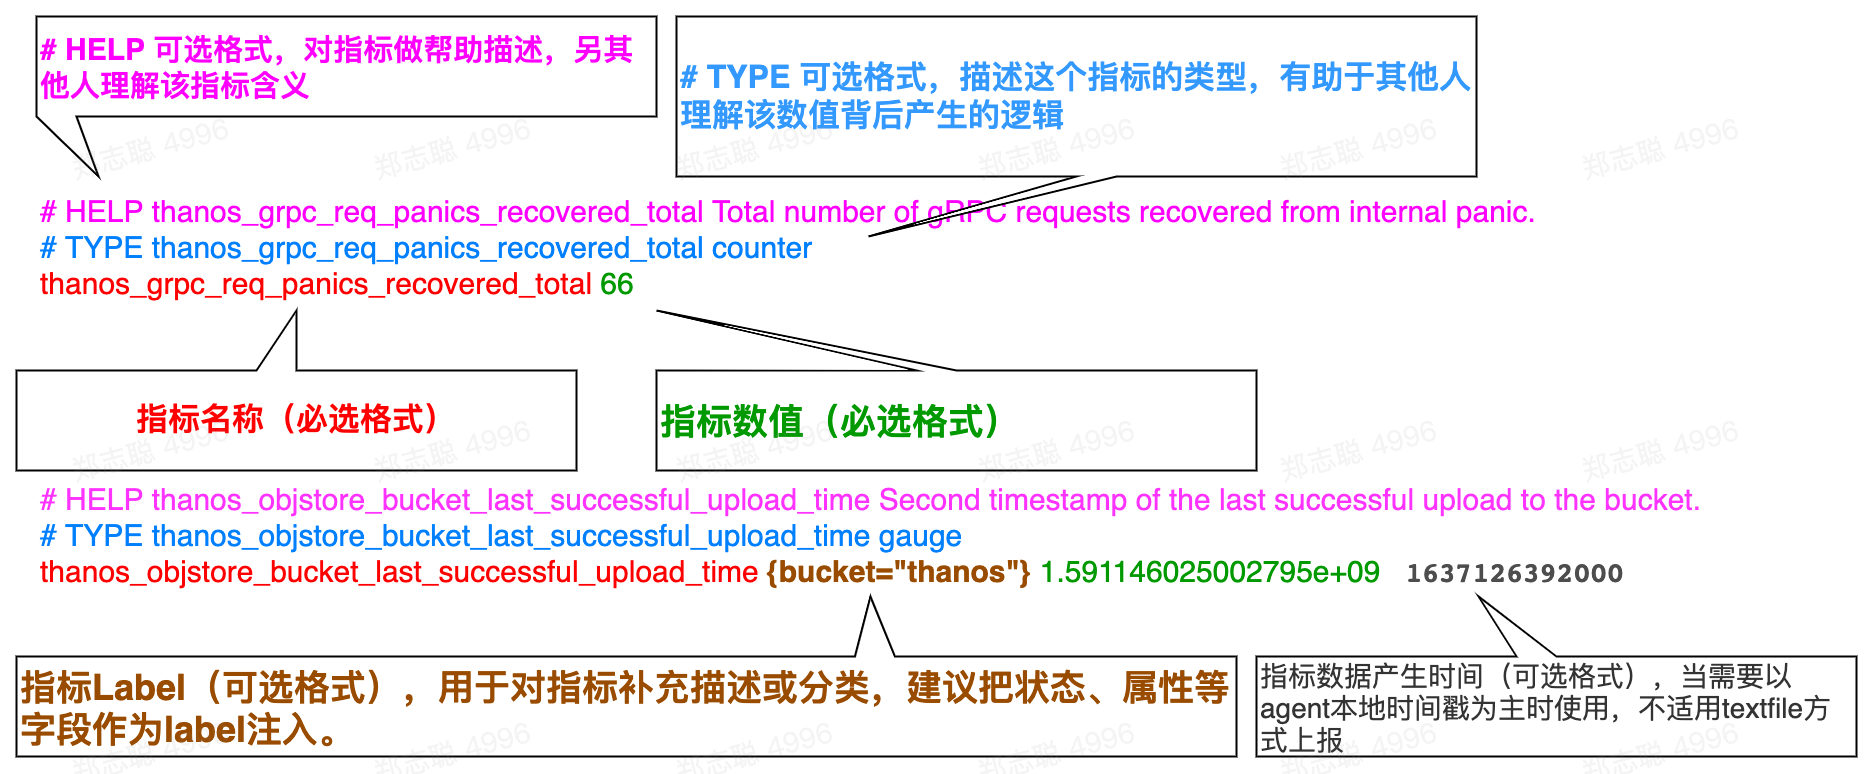
| |
Prometheus中定义了四种主要的指标类型:
- Gauge(仪表盘) 适用于可任意变化的指标,如温度,pressure。
- Counter(计数器) 只能单调递增的指标,适合记录如请求数,任务完成数,错误数等。
- Histogram(直方图) 一般用来记录请求持续时间,响应大小等指标。它通过配置桶来记录Value分布情况。可以用来计算分位值,平均值等。
- Summary 和Histogram类似,直接存储了分位值,可以更方便的计算分位值。
这四种指标类型可以表示不同类型的指标:
- Gauge:瞬时值
- Counter:计数总量
- Histogram/Summary:统计分布
根据需要的监控指标类型选择合适的类型。Prometheus在抓取和存储样本时,会根据类型做不同的处理。我们看一下以下案例。
告警配置
当需要告警的时候,就要部署Alertmanager组件,并且开始在Prometheus配置Alertmanager的信息,告警规则需要在Prometheus配置以进行周期性计算,把达到阈值的告警信息发送给Alertmanager组件来做处理。
关于
Prometheus的告警机制,以及它和Alertmanager的关系,以下简要说明:
Prometheus告警规则Prometheus服务器中定义了告警规则(rules),它根据PromQL指定的表达式判断是否要生成告警。一旦表达式输出结果为true,则会创建一个告警事件。Prometheus处理告警Prometheus会记录这些告警事件,并在其状态页面上展示告警信息。Prometheus还可以通过Webhook将告警信息发送到外部系统。Alertmanager概述Alertmanager是一个独立的告警管理组件。它支持告警去重、分组、路由、发送等功能。Prometheus服务器生成的告警会发送给Alertmanager。Alertmanager处理告警Alertmanager收到告警后,可以按照定义的分组方式对其进行分组,再按照路由规则发送到对应接收方,比如邮箱、Slack等。它也负责告警的去重。Prometheus和Alertmanager集成 在Prometheus中配置Alertmanager的URL地址,这样Prometheus生成的告警可以自动发送到Alertmanager。二者集成后,可以构成动态的告警管理机制。综上,
Prometheus负责告警检测与生成,Alertmanager专注于告警的后续分发、处理与告知流程。二者的集成可以完整实现从监控到告警的全链路。
 这里开始我们要理解
Prometheus的告警在时序上的状态
1、inactive:没有触发阈值
2、pending:已触发阈值但未满足告警持续时间
3、firing:已触发阈值且满足告警持续时间
用一个简单的例子来理解一下,以下配置一个mysql的告警,该指标的采集周期是5s一个样本点,配置了规则策略是每10s计算一次,当运行时小于30s则触发告警状态。
| |
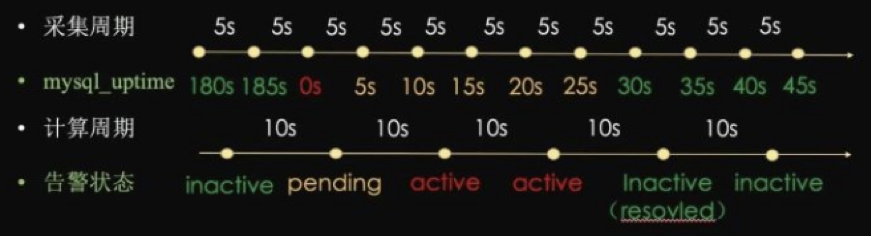 如上图所示
如上图所示
- 收集到的
mysql_uptime>=30,告警状态为inactive - 收集到的
mysql_uptime<30,且持续时间小于10s,告警状态为pending - 收集到的
mysql_uptime<30,且持续时间大于10s,告警状态为firing
⚠ 注意:配置中的for语法就是用来设置告警持续时间的;如果配置中不设置for或者设置为0,那么pending状态会被直接跳过。
告警内部逻辑
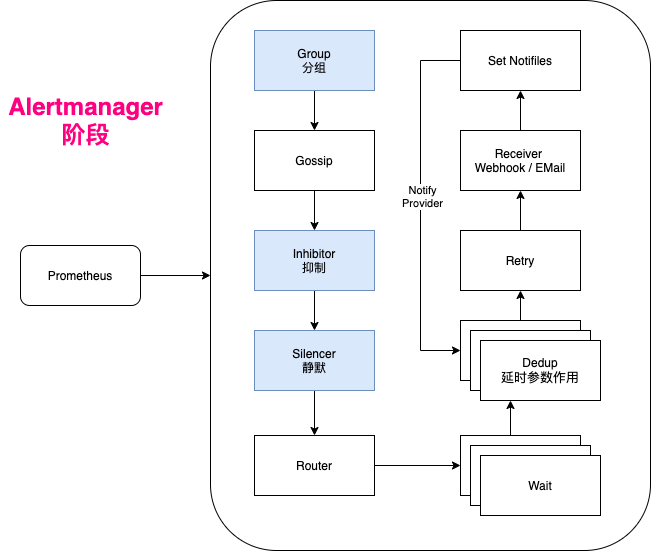
其内部机制可以总结为以下几个步骤:
- 告警的接收 Alertmanager从Prometheus等地方接收到告警后,会根据配置将告警组合成分组。
- 告警的分组 同类或者相关的告警会聚合到一起,形成一个告警分组,这通过配置文件中的分组规则来定义。
- 告警的去重 对于重复的告警,Alertmanager将进行去重,防止重复发送。
- 告警的路由 根据告警的匹配规则,确定该告警分组的发送路径,可能是通过邮件、Slack或者Webhook发送。
- 沉默和抑制 根据配置直接沉默或者在告警阶段抑制某些告警信息的发送。
- 告警的发送 最后Alertmanager将处理后的告警通过邮件、短信、电话等方式发送给接收人。
联邦部署
当达到一定规模,我们需要多个Prometheus帮忙分担采集和计算压力,可以尝试用联邦部署的方式来扩展架构。

⚠ 注意:个人不建议这种联邦架构,主要原因是管理成本较高,且该架构对后期的自动化二次开发不太友好。
分布式架构雏型
随着业务的扩展,监控系统也随之扩大,无论从架构管理上还是稳定性考虑都要从单体架构升级到集群架构,业界有多种方案选择:
Grafana社区的Cortex方案Thanos社区方案
这里选择了Thanos社区的分布式方案,同时在服务发现能力上引入HashiCorp的Consul来取替文件配置服务发现的能力.
数据处理逻辑架构
通过引入Consul管理需被监控采集的exporter采集器信息,这样运维就可以通过脚本开发定时从CMDB/CICD系统同步基建和业务组件等可被采集的信息到该架构实现动态发现采集能力。
另外通过Thanos Sidecar组件同步TSDB BLOCK到对象存储备份。

数据查询逻辑架构
前端查询用Thanos Query组件来实现整个分布式集群的统一入口查询能力,Thanos Query组件自身具备数据去重和联合查询。
历史数据可以通过Thanos Compact组件长周期数据聚合和降分辨率重聚合来优化底层TSDB BLOCK 。
对象存储的数据通过Thanos Store暴露API接口查询以减轻Prometheus的计算压力。
